How to Add Sheets to Google Docs: A Practical Guide
Learn how to add sheets to Google Docs by embedding charts from Sheets or pasting ranges as tables. This step-by-step guide covers live links, static data, formatting, and troubleshooting for students, professionals, and small businesses.

You will learn how to add sheets to google docs by embedding a live Google Sheets chart or by pasting a data range as a table. This two-method approach lets your Docs stay synchronized with Sheets data while preserving formatting. You’ll need access to both a Sheets file and a Google Docs document. According to How To Sheets, this integration simplifies reporting and reduces data duplication.
Overview of Sheets data integration in Google Docs
When you want to bring Sheets data into Google Docs, you have two reliable paths: a live, linked chart pulled from Sheets, or a static data range pasted as a table. Live charts stay synchronized with the source spreadsheet, so updates in Sheets can reflect in Docs after you refresh. Static tables capture a snapshot of data for a finished report where live updates aren’t required. According to How To Sheets, knowing when to link versus paste can save time and ensure consistency across documents. In both cases, ensure you have the proper access to the Sheets file and the Docs document. This guide uses clear steps and practical tips to help students, professionals, and small business owners apply the method that best fits their workflow.
Method A: Insert a chart from Google Sheets
In Google Docs, you can insert a chart that’s sourced from a Google Sheets file. The chart remains linked, so updates in Sheets can be reflected in the Docs document with a simple refresh. This is ideal for dashboards, KPIs, or any scenario where data visualization is central. First, open your Docs file and place the cursor where you want the chart. Then navigate to the Insert menu, select Chart, and choose From Sheets. A dialog will appear listing compatible Sheets files. Choose the correct file and select the chart you want to embed. After insertion, you’ll see a linked chart with a small refresh icon. When the source data changes in Sheets, click Refresh to update the chart in Docs. Pro tip: keep original sheet tabs tidy so you can quickly locate the right chart. How To Sheets recommends using meaningful chart titles to improve clarity in the Docs context.
Method B: Paste a range as a table (static data)
If you don’t need live updates, you can copy a data range from Sheets and paste it directly into your Google Docs document as a table. This method preserves formatting like borders, colors, and font styles, making it a fast option for static reports or proposals. To do this, select the desired range in Sheets, copy it (Ctrl+C or Cmd+C), switch to Docs, and paste (Ctrl+V or Cmd+V). After pasting, you can adjust column widths and apply table formatting. Note that unlike linked charts, this data will not update automatically if the source sheet changes. How To Sheets notes that this is ideal for final reports where data is historical or validated at publish time.
Managing live links and updates
Linked charts in Docs remain dynamic, provided the Sheets file is accessible and the link remains intact. To update, click the Refresh button near the chart in Docs, or use the Document menu to refresh all linked objects. If you lose access to the source Sheet, the chart will show a placeholder until access is restored. Keeping your Sheets file in a shared drive with appropriate permissions minimizes interruptions. How To Sheets emphasizes testing the refresh flow during the draft phase to ensure audiences see the latest data.
Formatting, accessibility, and best practices
Format linked charts for readability: captioning, alt text, and consistent sizing help accessibility and comprehension. Add a brief caption explaining what the chart shows and what the data represents. When pasting static tables, consider adding a header row with bold text and applying proper alignment. For accessibility, provide alt text that describes the chart’s purpose (e.g., “Monthly sales trend, units on left axis”). Always verify color contrasts and font sizes to ensure legibility in both screen readers and print formats. How To Sheets also recommends adding a brief context line before the embedded data to orient readers.
Common pitfalls and troubleshooting
Several issues can disrupt the flow of adding sheets to google docs. First, verify that the Sheets file remains accessible (not deleted or moved) and that the sharing settings allow access for collaborators. If the chart doesn’t appear after selecting From Sheets, try reselecting the file or refreshing the Docs page. For pasted tables, ensure you pasted in the correct place and that the data range didn’t include blank headers. If you see a mismatch in formatting, use Docs’ table tools to adjust borders and shading. How To Sheets advises keeping a small, clearly labeled sample data range to test the workflow before embedding large datasets.
Practical use cases: when to embed Sheets in Docs
Embedding Sheets charts in docs shines in monthly reports, project dashboards, and budget proposals where live data improves decision-making. For classroom assignments, linking charts helps instructors see up-to-date results without multiple file versions. In client deliverables, a mix of linked charts and static tables can balance live data with polished presentation. By following the two main methods—live charts and static tables—you can tailor your approach to the audience and purpose while maintaining a professional, navigable document. How To Sheets frequently sees teams streamline reporting cycles by using a consistent template that integrates Sheets data.
Tools & Materials
- Google Sheets file with data(Source dataset to be embedded or copied)
- Google Docs document(Target document where data will appear)
- Web browser with Google account(Chrome or preferred browser with access to Sheets and Docs)
- Stable internet connection(Needed for live linking and updates)
- Optional: captioning notes(Helpful for accessibility and context)
Steps
Estimated time: 20-40 minutes
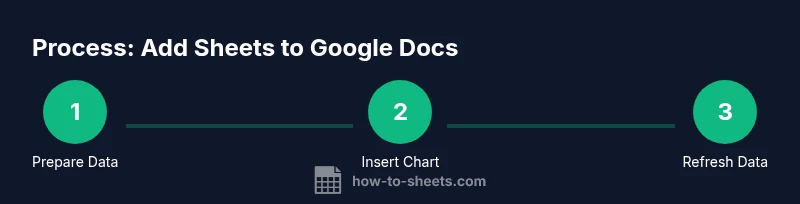
- 1
Prepare Sheets data
Clean the data range you plan to embed or chart. Ensure headers are clear and consistent, and that the range you will reference is well-defined. If you plan updates, consider named ranges to simplify reuse.
Tip: Use a named range in Sheets to easily reselect the data later. - 2
Open your Google Docs document
Navigate to the location where you want the embedded chart or table. Place the cursor at the exact spot for the insertion to maintain document flow and readability.
Tip: Check the page layout before inserting to ensure the content fits well. - 3
Insert a chart from Sheets
Go to Insert > Chart > From Sheets. Select the Sheets file, then pick the chart you want to embed. The chart appears as a linked object in your Docs document.
Tip: Choose a chart with a clear title and axis labels for readability. - 4
Choose the chart and insert
After selecting the chart, confirm the insertion. Resize or reposition as needed to fit your layout while keeping legibility in mind.
Tip: Use anchors to keep the chart aligned with surrounding text. - 5
Refresh linked charts when data changes
If the Sheets data updates, click the Refresh button on the chart in Docs to pull in the latest values. You can also refresh all linked objects from the Doc menu.
Tip: Test updates by changing a value in Sheets and refreshing to verify linkage. - 6
Paste a data range as a static table
Select the desired range in Sheets, copy, switch to Docs, and paste. The data remains static unless you repeat the copy-paste steps.
Tip: After pasting, adjust the table formatting for consistency with the document style. - 7
Enhance accessibility and presentation
Add a concise caption and alt text for the embedded chart or table. Ensure contrasts and font sizes align with accessibility guidelines.
Tip: Alt text should briefly describe the chart’s purpose and data shown.
FAQ
Can you link multiple Sheets charts in a single Google Docs document?
Yes. You can insert multiple charts from different Sheets files into the same Google Docs document. Each chart remains individually linked, so you can refresh them independently as needed.
You can insert multiple charts from different Sheets files and refresh each one individually.
Will the chart in Docs update automatically when Sheets changes?
Linked charts update when you manually refresh in Docs or when you reload the document. They do not auto-refresh in real-time without user action.
Linked charts update when you refresh them in Docs or reopen the document.
Is it possible to embed non-chart data from Sheets into Docs?
You can paste data ranges as static tables, which preserves formatting but does not update with Sheets. Charts, by contrast, are dynamic links.
You can paste static tables, but they won't update automatically like charts.
What if I don’t see the Insert Chart option?
Check that you are in a Google Docs document with internet access and the correct permissions for the Sheets file. If necessary, sign out and back in or reload the page.
Make sure you have internet access and the right permissions, then reload the page if needed.
Does embedding Sheets data affect sharing or permissions?
Linked charts rely on access to the source Sheets file. If someone lacks access, they may not see updated data until access is granted. Keep permissions aligned for everyone who edits or views the Docs.
If viewers can’t access the Sheets file, they may not see updated data until permissions are adjusted.
Watch Video
The Essentials
- Embed live Sheets data with charts for dynamic docs
- Choose between live charts and static tables based on needs
- Refresh linked content to keep data current
- Export and present content with accessibility best practices
- Plan and test the workflow to avoid broken links