
Charts and Data Visualization
Tracking Google Sheets Visitors: A Step-by-Step Guide
5 min
Create charts and visualize data in Google Sheets.
120 articles


Urgent guide to fix a broken line graph google sheets. Learn quick data checks, axis formatting, and rebuild tips to restore accurate charts in Sheets. Ideal for students, professionals, and small business owners needing fast, reliable results.


A thorough, analytical comparison of Excel, Sheets, and Numbers, covering data modeling, collaboration, automation, pricing, and ecosystem to help you pick the best spreadsheet tool for your needs in 2026.
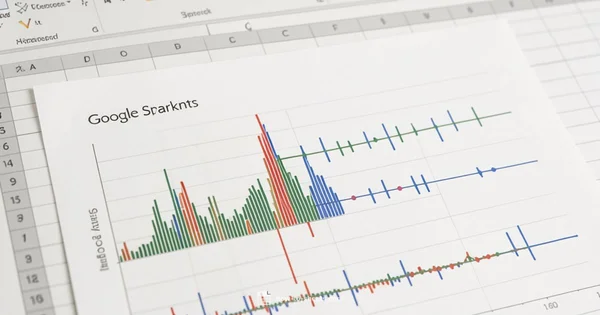
Learn the three sparklines types in Google Sheets and how to use SPARKLINE for compact inline charts. Practical tips, formulas, and best practices for dashboards and reports.
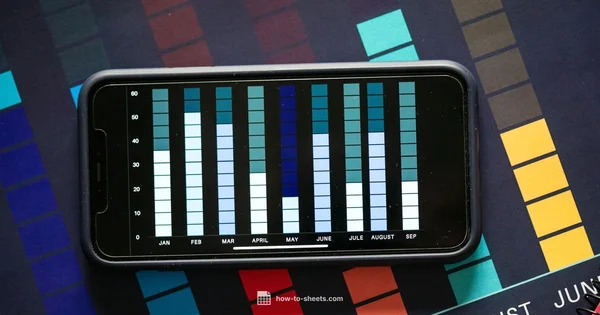
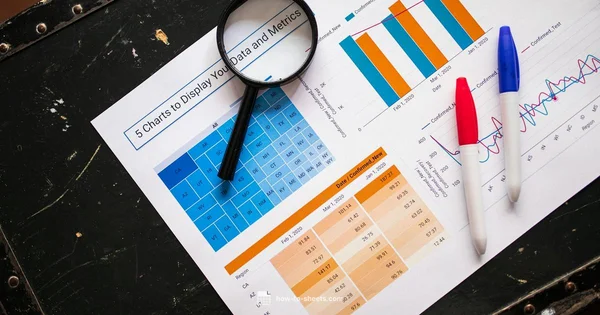
Discover the types of Google Sheets charts, when to use each chart style, and tips for customizing axes, labels, and colors to improve data storytelling.