Solving 'my google sheets doesn't have timeline' in Google Sheets
If 'my google sheets doesn't have timeline', follow this urgent, step-by-step troubleshoot guide to diagnose missing timeline features, format data correctly, and apply practical fixes in Google Sheets.

Most often, the timeline option is not visible because Google Sheets lacks a directly named Timeline chart for your dataset. Quick fix: confirm data is date-formatted, open Insert > Chart, and look for a Timeline or Gantt-like chart; if Timeline isn’t available, switch to a compatible chart type (bar/line with a date axis) and format your data accordingly. Use a workaround until a native Timeline appears.
Why my google sheets doesn't have timeline
If you're asking 'my google sheets doesn't have timeline', the likely reason is that Google Sheets does not expose a dedicated Timeline chart in every dataset. This isn't a bug—it's a compatibility issue between your data structure and the chart options available in your Sheets interface. In most cases, you can fix this by ensuring your dates are properly formatted, your data includes start and end dates (or a duration), and you select a chart type that supports time-based visualization. By understanding these limitations, you can quickly move toward a working timeline or a robust workaround.
Data formatting essentials for timeline charts
A timeline visualization usually relies on date fields to place events along a horizontal axis and a measure such as duration or end date to size the bars. To prepare, create at least: a Start Date column with true date values, an End Date or Duration column, and a Task/Event column. Ensure every date cell is recognized by Sheets as a date (Format > Number > Date). Avoid text-formatted dates, as they break the axis and any timeline logic. If your data isn't structured this way, timeline options may not appear or display incorrectly.
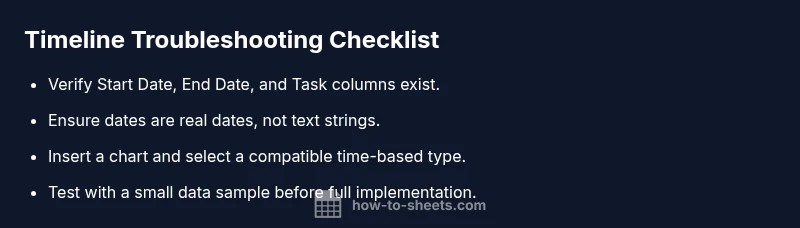
Quick checks before enabling a timeline
- Verify dates are real dates, not text strings. Use DATEVALUE if needed.
- Confirm you have at least one start and end date for an item.
- Remove blank rows within your data range and keep headers clear.
- Check that you’re using a compatible chart type and that your sheet is not in a restricted mode. If these checks don’t reveal the issue, consider the next section’s workarounds.
Workarounds when Timeline isn't available natively
If Google Sheets doesn’t offer a built-in Timeline, you can simulate one with a bar or area chart and a date axis. Create a helper column for start offset or days since a baseline, then format the horizontal axis to display dates. A stacked bar chart can show duration per task, giving a similar visual as a timeline. For more complex needs, export the data to Google Data Studio or another visualization tool.
Common pitfalls to avoid
- Formatting dates as text: convert with DATE or DATEVALUE.
- Assuming Timeline exists in all data setups: adapt by using alternative chart types.
- Overloading the sheet with too many series: simplify to keep the timeline readable.
- Losing original data when trying to manually draw timelines: always back up first.
Steps
Estimated time: 30-45 minutes
- 1
Audit your dataset
Review your data to confirm there is a Task column and at least one corresponding Start Date and End Date. Ensure dates are valid and not text strings.
Tip: Use a simple sample row to test a chart first. - 2
Convert dates to proper date format
If any date looks like 12/31/2025 as text, convert using DATEVALUE or re-enter the date to force date formatting.
Tip: Format the cells as Date (Format > Number > Date) before charting. - 3
Insert a chart and select a timeline-friendly type
Click Insert > Chart, then browse chart types for anything time-based or bar/line with a date axis. If Timeline is present, configure using Start, End, and Task fields.
Tip: If Timeline isn’t listed, choose a bar chart and map Start Date to the axis and Duration to bar length. - 4
Create a duration helper if needed
Add a Duration column (End Date minus Start Date) to quantify length and facilitate a timeline-like visualization.
Tip: Keep Start Date non-editable once chart is set to avoid misalignment. - 5
Refine axis formatting
Adjust the horizontal axis to show dates clearly (format axis, set date scale, and label intervals).
Tip: Use a baseline date and display only relevant date ranges to improve readability. - 6
Validate results and test edge cases
Double-check several tasks with varying durations, including zero-duration items to ensure axis accuracy.
Tip: Save a copy of the original data before making large chart changes.
Diagnosis: Timeline option not visible or timeline chart not rendering correctly in Google Sheets
Possible Causes
- highData not structured with clear Start/End dates or a duration column
- highSelected chart type does not support timeline-style visualization
- mediumDate fields stored as text rather than real dates
- lowFeature limitations or regional/settings differences
Fixes
- easyReformat date columns as real dates and add explicit Start Date, End Date, and Task columns
- easyInsert a chart and choose a compatible type (bar/line with a date axis) if Timeline is unavailable
- easyConvert text dates with DATEVALUE or use data validation to enforce dates
- easyClear caches/try another browser or incognito to ensure latest Sheets features load
- mediumIf native timeline is still missing, consider exporting to Google Data Studio for timeline visualization
FAQ
What is a timeline chart in Google Sheets?
A timeline chart visualizes events over time using date fields. In Sheets, you can simulate timelines by aligning start dates, end dates, and durations with a date axis.
Timeline charts visualize events over time; you can simulate them in Sheets with start and end dates on a date axis.
Why can't I find the timeline option in the Chart Editor?
Not all datasets expose a native Timeline option. Check data structure, ensure dates are real dates, and consider a compatible chart type or a workaround.
If you don't see Timeline, you may need to use a different chart type or restructure your data.
How should I structure data for a timeline-like chart?
Include at least: Task, Start Date, End Date (or Duration). Ensure Start and End dates are valid dates and not text.
Have a task column with start and end dates for each item.
Are there safe workarounds if Timeline isn't available?
Yes. Use a bar or line chart with a date axis, or export to Google Data Studio for advanced timeline visuals.
Yes. You can simulate with a bar chart or move data to Data Studio for timelines.
Do I need to install add-ons to access timelines?
Add-ons can extend chart options, but Timeline isn't a standard Sheets feature—reformatting data or using a workaround often suffices.
Add-ons can help, but a native timeline may not be available; consider alternatives.
What should I do if data loss seems possible?
Always duplicate the sheet before making major chart changes. This preserves your original data while you experiment.
Make a copy of your sheet first to avoid data loss.
Watch Video
The Essentials
- Check data structure before charting.
- Use compatible chart types when Timeline is absent.
- Format all date fields as real dates.
- Back up data prior to major chart changes.