
Formulas and Functions
Google Sheets Z Score to Percentile: A Practical Guide
5 min
71 articles


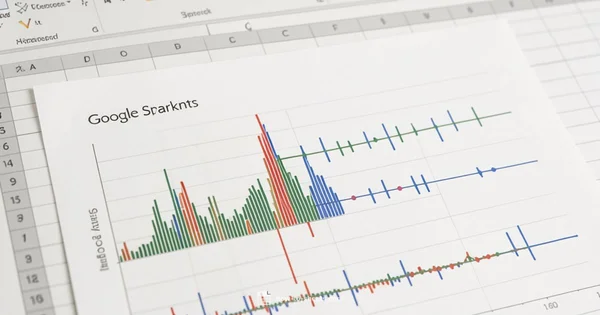
Learn how to compute and visualize the best fit in Google Sheets using LINEST, TREND, and chart tools. This step-by-step guide covers formulas, interpretation, and practical examples for students, professionals, and small business owners.

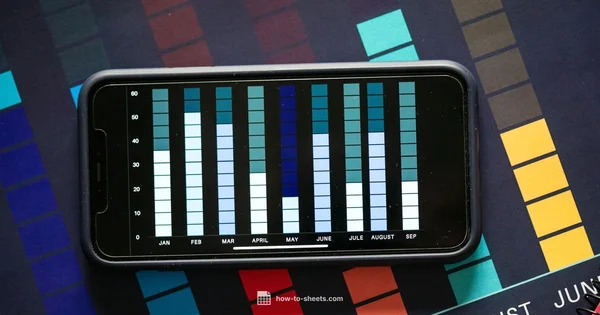
Discover the types of graphs google sheets and how to choose, create, and customize charts in Google Sheets with practical steps for students, professionals, and small businesses.
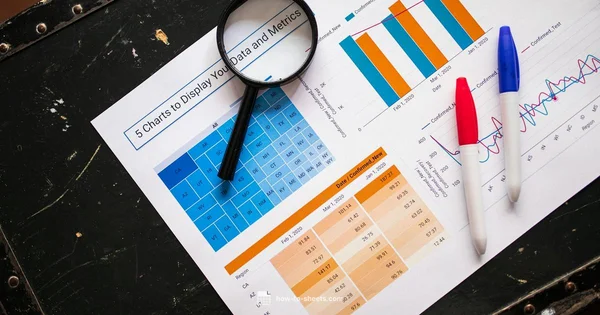
Learn to build a coverage tracker in Google Sheets that maps tasks to criteria, highlights gaps, and visualizes progress with a reusable template for students, professionals, and small teams.
Urgent guide to fix a broken line graph google sheets. Learn quick data checks, axis formatting, and rebuild tips to restore accurate charts in Sheets. Ideal for students, professionals, and small business owners needing fast, reliable results.