Timeline in Google Sheets: Practical Step-by-Step Guide
Learn how to create a flexible milestone timeline in Google Sheets with layouts, data models, and visuals. This practical, step-by-step guide helps students, professionals, and small businesses build reusable timelines.

By the end of this guide you will create a functional timeline in Google Sheets that tracks milestones, dates, and dependencies. You'll learn to choose a timeline layout, set up date fields, map milestones to a calendar-like grid, and add visual cues with conditional formatting. Basic requirements: a sheet with at least one date column, a milestone name column, and optional owners or status.
Why timeline in google sheets matters
For teams that juggle deadlines, milestones, and dependencies, a visual timeline built directly in Google Sheets keeps everyone aligned without switching apps. A well-structured timeline in google sheets makes dates, owners, and progress visible at a glance, reduces miscommunication, and helps you spot bottlenecks early. According to How To Sheets, starting with a simple data sheet and a clear layout is the backbone of an effective timeline. When designed for reuse, it also becomes a powerful template you can copy for future projects. In practical terms, you can track key milestones from kickoff to delivery, assign responsibilities, and visualize critical paths with color cues. Because Google Sheets is accessible to students, freelancers, and small businesses alike, building a timeline in Sheets lowers the barrier to strong project governance. By keeping updates centralized, your team can comment on changes in real time, maintain an auditable history, and align on priorities. This approach also scales: you can start small and gradually add columns for status, risk, or dependencies as your project grows. For daily tasks and long-horizon roadmaps, a timeline in google sheets provides clarity, accountability, and a single source of truth.
Planning your timeline: data you need
A successful timeline in Google Sheets starts with clean data. List each milestone as a row and capture essential fields: a milestone name, a start date, and an end date or duration. Add owner or team member to assign accountability, and include status to indicate progress. If you anticipate dependencies, create a column for predecessor milestones or dependency notes. Decide whether you want a calendar-style timeline (dates across the top) or a bar-based timeline (horizontal bars across a date axis). In both cases, use consistent date formats (YYYY-MM-DD is a good baseline) and normalize text fields like owner names and statuses. Think about what decisions or deliverables define “done,” and be explicit about acceptance criteria. Before you start building visuals, sketch a rough data model on paper or in a scratch tab. This planning phase reduces rework and ensures your Google Sheets timeline aligns with how your team actually works. How To Sheets finds that careful data planning is the single most important step when creating timelines in Google Sheets.
Layout options for timelines in Google Sheets
Two common layouts work well for a timeline in Google Sheets: the calendar-grid timeline and the bar-timeline. The calendar grid puts dates along the top and lists milestones down the side; each cell can indicate whether a milestone is scheduled, in-progress, or complete. The bar timeline uses colored bars to represent durations for each milestone across a shared date axis. Both layouts can be implemented with a combination of simple formulas and conditional formatting. For beginners, starting with a basic calendar grid is usually easiest: you’ll create a date column, then use conditional formatting rules to fill cells that intersect with milestone dates. For more advanced users, bar-style timelines provide a clearer sense of duration and overlap, especially for larger projects. You can augment either layout with summary rows, color legends, and filters to focus on active milestones. The key is to keep the layout consistent and easily updateable so non-technical teammates can participate without breaking formulas. In short, choose the layout that matches your team’s needs and scale it as needed.
Building the data model: fields and relationships
To support a robust timeline in Google Sheets, design a compact data model that separates raw data from visuals. Create a sheet—call it Milestones—with columns such as milestone, start_date, end_date, duration (calculated), owner, status, and notes. Use a formula to compute duration as end_date - start_date, and apply date validation to ensure correct input. Build a second sheet called Timeline where you render the visuals based on the Milestones sheet. Use named ranges like Milestones!A:E to make formulas easier to read. Then, add a dependency column to capture relationships between milestones, such as “Milestone B depends on Milestone A.” If you have multiple projects, consider a project_id column to group milestones. By separating data and view logic, you can update one source of truth without touching the visuals. This approach also makes it easier to reuse the same data model for different timeline styles, dashboards, or reports. As you populate fields, keep data consistent: use dropdowns for status, standardized date formats, and uniform owner names.
Visualizing milestones: grid, bars, and conditional formatting
With the data model in place, you can turn milestones into a visual timeline within Google Sheets. For a calendar-grid, place date headers across the top edge and use formulas to map each milestone's duration to colored cells under the appropriate dates. For example, a left-aligned bar can be created by filling cells where the header date falls between start_date and end_date. Apply conditional formatting rules to color those cells, using a legend to indicate not started, in progress, and completed. For a bar-timeline, you can create a hidden helper grid that computes the number of days between start and end dates, then present a colorful bar by filling a cell’s background color where the bar intersects. This technique makes the timeline easy to scan, and you can add progress indicators or icons via emoji or custom fonts. If you want to press play, attach a dynamic chart (a Gantt-like chart) that reads the Milestones data and updates as dates shift. The end result is a readable, shareable timeline in Google Sheets that communicates schedule risk and critical path at a glance.
Automations, templates, and common pitfalls
Smart automation can save hours in a timeline in Google Sheets. Build templates with pre-populated columns, starter formulas, and sample milestones so new projects can be set up in minutes. You can even link your timeline to Google Calendar or to other sheets for automatic updates. Use Apps Script or built-in functions to auto-populate end dates based on duration, or to flag overdue milestones. A few common pitfalls to avoid: inconsistent date formats, inconsistent owner names, and overcomplicated layouts that become hard to maintain. Always test by copying your sheet and running through a full scenario—from kickoff through delivery—to ensure the visuals reflect the data. How To Sheets suggests starting with a lean template and gradually layering on complexity as your needs grow. That iterative approach helps you maintain accuracy and keeps your timeline flexible as projects evolve.
Authority sources
Here are authoritative references to help you extend timelines in Google Sheets:
- https://support.google.com/docs/answer/139706?hl=en
- https://www.nist.gov
- https://www.nature.com
Real-world templates and examples
Look for ready-made templates: In Google Sheets, you can start with a Timeline template and adapt to your project. For instance, a milestone-based roadmap template can be easily integrated into a calendar view, with start dates and end dates and ownership. Use real-world examples from students who track class projects, freelancers coordinating client deliverables, or small businesses planning product launches. The timeline in google sheets can be customized with conditional formatting to highlight critical milestones, delays, or dependencies. Consider copying a template, renaming sheets, and adjusting date ranges to fit your schedule. With this approach, your team gains a reliable, repeatable method for delivering results on time.
Advanced tips for efficiency
To boost efficiency in a timeline in Google Sheets, use named ranges, dynamic named ranges with data validation, and query functions to pull subsets of milestones. Create a reusable template with a separate data sheet and a visuals sheet; share it with teammates and set permissions to protect formulas. Use conditional formatting with a color palette that remains consistent across projects. You can also attach notes to cells that explain decisions or constraints so new contributors understand the logic. Over time, your template becomes more robust, enabling faster onboarding and better communication across teams.
Tools & Materials
- Computer or mobile device with internet access(Any modern browser (Chrome preferred))
- Google account with Sheets access(Needed to save and share timelines)
- A data sheet with milestones, dates, and owners(At minimum: milestone, start_date, end_date)
- Optional: prebuilt timeline or calendar template(Speeds up setup)
- Color palette and conditional formatting rules(For visual clarity and consistency)
Steps
Estimated time: 30-60 minutes (plus time to populate data and test)
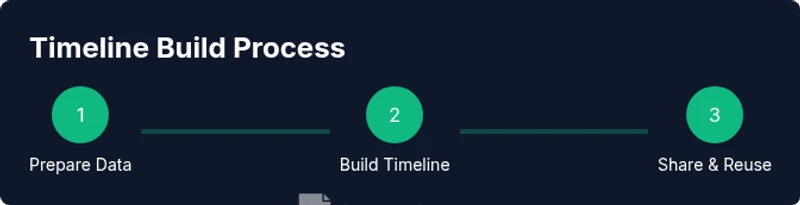
- 1
Prepare your data sheet
Create a Milestones sheet with columns for milestone, start_date, end_date, duration, owner, status, and notes. Use data validation for start_date and end_date to ensure valid dates.
Tip: Use a header row and named ranges for clarity. - 2
Define the timeline layout
Decide between a calendar-grid or bar-timeline. A calendar grid is simpler for beginners; a bar timeline highlights duration and overlap.
Tip: Sketch the layout on paper before building formulas. - 3
Compute duration and validate data
Add a duration formula (end_date - start_date) and verify dates align with the project's timeframe. Add data validation for status using a dropdown (Not Started, In Progress, Completed).
Tip: Keep date formats consistent (YYYY-MM-DD). - 4
Build the timeline visuals
In a Timeline sheet, map duration to a date axis using conditional formatting to create colored bars or grid cells.
Tip: Test with a small sample before full data load. - 5
Add ownership and status cues
Include Owner and Status columns to clarify accountability. Use color coding for status to turn the sheet into a quick status board.
Tip: Use consistent owner naming to avoid duplicates. - 6
Create a reusable template
Save the sheet as a template and document the steps so new projects can be created in minutes.
Tip: Include a sample milestone to demonstrate layout. - 7
Automate repetitive updates
If needed, use basic Apps Script or built-in functions to auto-fill dates or flags based on milestones.
Tip: Start with small automations to avoid breaking formulas. - 8
Review and refine
Test with a real project; ensure visuals update when dates shift and that the data remains consistent.
Tip: Gather feedback from teammates and adjust the template accordingly.
FAQ
What is the best layout for a timeline in Google Sheets?
The best layout depends on your project size. A calendar-grid is beginner-friendly and shows dates clearly, while a bar-timeline emphasizes duration and overlaps for larger projects. Start simple and scale.
Start with a calendar grid for clarity, then switch to a bar timeline if you need to visualize duration and overlap.
Can I automate timeline updates across sheets?
Yes. You can automate date adjustments and status flags with built-in formulas or Apps Script. Start with simple automations (auto-fill end dates) and expand as needed.
Yes. Begin with small automations and gradually add more complex ones as you gain confidence.
What data should I include in a timeline?
Include milestone name, start date, end date or duration, owner, and status. Optional fields like dependencies or notes help with planning and accountability.
Milestones, dates, ownership, status, and optional dependencies are the core data.
How do I customize colors in a timeline?
Use conditional formatting to assign colors by status or priority. Create a small color legend and keep a consistent palette across projects.
Color by status with a simple conditional rule and keep a consistent palette.
Is a timeline in Google Sheets suitable for large projects?
Google Sheets scales well for moderate timelines. For very large projects, consider splitting data across multiple sheets or using a dedicated project management tool for complex dependencies.
It works for moderate timelines; for very large projects, split data or consider more advanced tools.
Can I export timeline data to other formats?
Yes. You can copy data to another Sheets file or export as CSV/Excel from Google Sheets, preserving the timeline structure and color formatting in many cases.
You can export to CSV or Excel and retain most timeline formatting.
Watch Video
The Essentials
- Plan data structure before visuals.
- Choose a layout that fits your workflow.
- Use conditional formatting for clear status cues.
- Reuse templates to save time on future timelines.
- Maintain data consistency with validation.