Separate Google Sheets: A Practical Step-by-Step Guide
Learn how to separate google sheets across multiple workbooks, when to do it, and how to link data safely with IMPORTRANGE and QUERY for cleaner dashboards and collaboration.

Separate Google Sheets means keeping data in distinct workbooks or spreadsheets to improve organization, permissions, and performance. This approach helps when teams split projects, budgets, or datasets, while still enabling data connections through linking formulas like IMPORTRANGE and QUERY. For dashboards, separate sheets prevent data locking and simplify access control. For cross-team reporting, each department can own a sheet while a central sheet aggregates results via formulas. This guide explains planning, implementation, and maintenance of a multi-sheet workflow without sacrificing data integrity.
What separate google sheets means in practice
In practice, separating Google Sheets means dividing data across multiple workbooks or spreadsheets instead of stacking everything into a single file. By distributing datasets, teams can control who can see what, reduce file size, and speed up calculations. This approach is especially useful when datasets grow large, when different teams own different parts of the data, or when projects run on different timelines. When you separate google sheets, you create logical boundaries that keep sensitive information from unauthorized viewers and prevent accidental edits from unrelated teams.
However, this approach also introduces complexity. Cross-file linking becomes necessary to produce unified reports, while maintaining consistency across sheets requires discipline in naming conventions, data formats, and update schedules. In this guide, you’ll learn how to plan, implement, and maintain a multi-sheet workflow that remains coherent and auditable. By the end, you’ll be able to decide when to separate sheets, design a scalable structure, and connect the data across workbooks using built-in Google Sheets features.
When to consider separating Sheets
Not every dataset benefits from being split across multiple Google Sheets. The decision should hinge on data sensitivity, collaboration patterns, and performance. Consider separating sheets when: (1) access needs diverge by department, client, or project; (2) one dataset frequently changes while another is reference-only; (3) the file size or calculation load begins to slow down response times; (4) you want archival versions of old data without cluttering the main dashboard. Conversely, single-sheet with multiple tabs can be preferable when data volumes are small, users require a single view, or when cross-file automation would complicate maintenance.
In practice, you might use separate sheets for: raw data repositories, calculations and models, and outputs or dashboards. Naming conventions are critical: use prefixes that reflect data domains (e.g., "Sales_Raw", "Finance_Models", "Marketing_Outputs"). Establish a policy for refreshing data: decide who updates the source, how often, and how to handle stale data. This ensures your team benefits from separation without creating a maintenance nightmare. The key is to balance isolation with accessibility so that the overall business process remains auditable and reproducible.
Designing a scalable multi-sheet structure
A scalable structure starts with planning data domains and owner groups. Create a Drive folder scheme such as a top-level folder for the project and subfolders for each domain (Raw Data, Calculations, Dashboards, Archives). Within each workbook, reserve dedicated sheets for raw data, intermediate calculations, and outputs. Use consistent naming conventions: prefixes like RAW_ for raw inputs, CALC_ for models, and DASH_ for dashboards. Implement a central index workbook or a master dashboard that references data through controlled links, so end users see a single view while the source files remain compartmentalized.
Templates matter. Build starter templates with predefined header rows, data types, and validation rules. Enforce a standard header structure (column names, data types, and required fields) and define data formats (dates, currencies, text). Document every rule in a data dictionary sheet so team members understand expected inputs. Finally, set a simple change log to capture edits and decisions, ensuring future auditors can trace how sheets evolved over time.
Linking data across separated sheets
Linking data across separated sheets is essential for consolidated reporting without duplicating data. Use IMPORTRANGE to pull data from a source workbook into a destination workbook. Combine IMPORTRANGE with QUERY to filter rows, sort results, and derive aggregates. Named ranges improve readability and reduce breakages when column orders change. Create a lightweight data bridge by exporting a compact, stable view (only necessary fields) in the source workbook and importing that view into shared dashboards.
Permissions play a role. The first time you use IMPORTRANGE, you’ll need to grant access between the two workbooks. Keep data refresh in mind: IMPORTRANGE doesn’t run in real-time like local formulas; expect minor delays. For more complex flows, consider a middle-layer sheet that consolidates data before you present it on dashboards. This reduces risk if the source structure evolves and keeps downstream reports stable.
Security, governance, and collaboration across multiple sheets
Security and governance are critical when data lives in several Sheets. Apply the principle of least privilege: grant viewers and editors only to the files they need. Prefer per-file access over sharing a single workbook broadly. Use separate sheets for sensitive data and restrict cross-file access to aggregate views whenever possible. Maintain a data dictionary and a documented change process; this makes it easier to reproduce analyses and audit data lineage.
Regularly review sharing settings and enable version history to track changes. Enable two-factor authentication for accounts with access to critical data. Archive old data in a separate folder and include archival notes, so dashboards stay fast while historical context remains accessible if needed.
Quick-start example: a practical setup
Imagine a small marketing team splitting its data into three workbooks: RAW_Marketing_Data (source receipts and campaign logs), CALC_Marketing_Models (attributions and ROI models), and DASH_Marketing_Reports (executive dashboard). In RAW_Marketing_Data, keep clean headers and data validation. In CALC_Marketing_Models, reference RAW_Marketing_Data with IMPORTRANGE, then perform calculations. Finally, DASH_Marketing_Reports pulls key metrics through a dedicated view workbook that uses IMPORT and QUERY to present a compact, shareable snapshot. This setup reduces file size, limits who edits source data, and keeps dashboards fast and reliable. Regularly update the data dictionary to reflect new fields and rename sheets as you evolve the model.
Tools & Materials
- Computer with internet access(Any modern browser; Chrome/Edge recommended for best compatibility)
- Google account(Must have access to Google Drive and Sheets)
- Access to Google Sheets(Familiarity with IMPORTRANGE and QUERY helps)
- Structured folder plan (Drive)(Optional but recommended to organize workbooks by domain)
- Template data dictionaries and starter templates(Prebuilt headers, data types, and validation rules)
Steps
Estimated time: 60-90 minutes
- 1
Define data domains and ownership
List all data sources you plan to separate and assign an owner for each domain (e.g., Raw Data, Calculations, Dashboards). This clarity guides workbook structure and access control.
Tip: Create a one-page data domain map before starting. - 2
Create a Drive folder structure
Set up a main project folder with subfolders for each domain. Place related Sheets inside their domain folder to keep data isolated and accessible.
Tip: Establish a naming convention for folders that mirrors data domains. - 3
Build workbook templates
Create Raw Data templates with headers, Data Validation rules, and format standards. Add a Calc template that consumes raw data, and a Dashboard template that reads from the Calc sheet.
Tip: Lock the template cells to prevent accidental deletions. - 4
Set up cross-file links
In destination workbooks, use IMPORTRANGE to pull data from source workbooks. Add a simple QUERY to filter and sort results for dashboards.
Tip: Use a named range in the source to simplify references. - 5
Create a central index/dashboard
Build an index sheet that aggregates links to key reports and a summary dashboard that pulls metrics from Calc sheets. This gives users a single entry point.
Tip: Document data sources in a dedicated Documentation tab. - 6
Test data integrity and refresh
Run end-to-end checks to compare source data with dashboard results. Verify a refresh cadence and confirm that changes propagate correctly.
Tip: Schedule periodic data-quality checks. - 7
Document, share, and govern
Create a data dictionary, a change log, and sharing guidelines. Ensure any future changes are recorded and communicated to teammates.
Tip: Keep a living README in the project root.
FAQ
What is meant by separate google sheets?
Separating Google Sheets means distributing data across multiple workbooks instead of keeping everything in one file. This can improve organization, access control, and performance, especially when datasets grow or teams diverge in responsibilities. You can still link and summarize data across those sheets when needed.
Separating sheets means using multiple files to manage data, then connecting them for reports. It helps teams stay organized and secure while still allowing joint analyses.
How do I share multiple sheets safely?
Share files individually with the people who need them, rather than giving broad access to one master file. Use Viewer/Commenter/Edit permissions as appropriate and restrict editing to source data files. Maintain a documented access policy in your project README.
Share each file with the right people, limit permissions, and keep a clear access policy in your documentation.
Can I pull data from several sheets into one dashboard?
Yes. Use IMPORTRANGE to fetch data from source sheets and then apply QUERY, FILTER, or VLOOKUP to synthesize the results into a single dashboard. This minimizes duplication and keeps data consistent.
Absolutely. Import from each sheet and filter or aggregate to build a unified dashboard.
What are best practices for naming sheets?
Adopt a consistent prefixing scheme (e.g., RAW_, CALC_, DASH_) and include a date or version where relevant. This makes it easier to identify sources at a glance and reduces confusion when linking across files.
Use consistent prefixes and include dates or versions to keep things clear.
Is it better to use a single sheet with tabs or separate sheets?
For small datasets and simple workflows, a single workbook with multiple tabs can be simpler. For larger teams, different data domains, and stricter access control, separating into multiple workbooks often makes governance easier and performance better.
Single-file with tabs is fine for small cases; many projects benefit from multiple files for governance and performance.
How do I ensure data integrity when data is split across sheets?
Maintain a data dictionary, use consistent data formats, lock critical cells in templates, and implement regular data-quality checks. Version history helps recover from mistakes, and documented rules prevent drift.
Keep a data dictionary, enforce formats, and use version history to guard against drift.
Watch Video
The Essentials
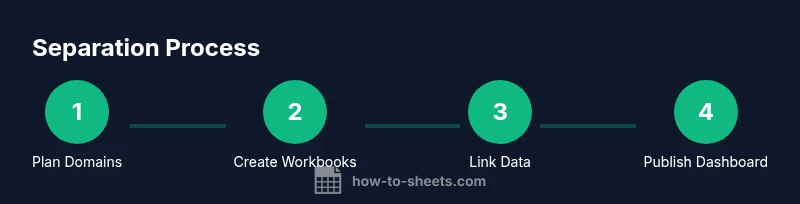
- Plan data domains before creating sheets.
- Use a central index to simplify access.
- Link data carefully with IMPORTRANGE and QUERY.
- Maintain clear documentation for governance.
- Regularly review security and data integrity.