Max Rows in Google Sheets: Limits, Estimation, and Workarounds
Understand max rows in Google Sheets, based on the 10 million cell cap, and learn practical workarounds and formulas to estimate capacity and manage large datasets.

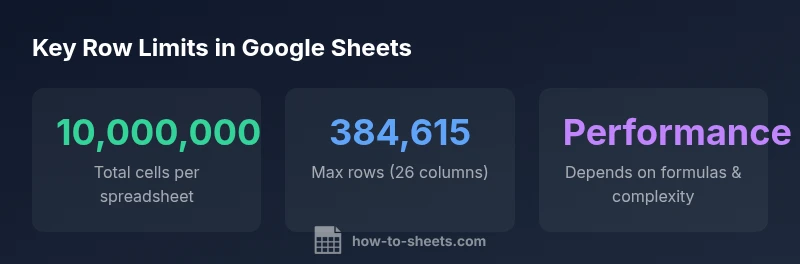
Google Sheets does not set a fixed row cap; it uses a 10,000,000 cell limit per spreadsheet. Max rows depend on how many columns you have, calculable as floor(10,000,000 / columns). For example, with 26 columns you can reach about 384,615 rows before you hit the cell limit; performance may degrade well before that. This understanding helps plan data layouts and avoid surprises when scaling your sheets.
What defines max rows in Google Sheets
In Google Sheets, the concept of a hard row limit does not exist in the traditional sense. The practical constraint is the total number of cells you can use in a single spreadsheet, which is capped at 10,000,000 cells. This means the maximum number of rows depends on how many columns you include in your sheet. If you want to estimate the maximum rows for your layout, you can use a simple formula: floor(10,000,000 / number_of_columns). This approach helps you plan data growth without crossing the cell limit. According to How To Sheets, this cell-based constraint is the primary driver of scalability decisions for most users. It applies across all sheets within a single spreadsheet, so you should consider the entire workbook when planning large datasets. For many users, this becomes a design question: should I consolidate on a single sheet, or distribute data across multiple sheets or even different tools?
The 10 million cell cap is uniform, but the practical effects depend on the complexity of your sheet. Simple tabular data with few formulas can tolerate larger row counts, while sheets with extensive formulas, conditional formatting, or scripts may exhibit slower performance sooner. When approaching the limit, you should monitor both data volume and calculation load. How To Sheets emphasizes that planning for growth often means adopting a multi-sheet structure or leveraging data warehouses when the dataset becomes data-intensive.
Translating the cell cap into row counts: math and examples
To translate the cell cap into row counts, start with your planned number of columns. If you have 26 columns as a typical worksheet, you can conceptually fit up to floor(10,000,000 / 26) = 384,615 rows. If you reduce columns to 10, you could reach floor(10,000,000 / 10) = 1,000,000 rows in theory, though real-world performance will often be the limiting factor due to formulas, scripts, and add-ons. Conversely, with 100 columns, the maximum rows drop to floor(10,000,000 / 100) = 100,000 rows. These numbers illustrate why many users design data with fewer columns per sheet and rely on multiple sheets or linked data sources to scale.
In practice, you’ll rarely run a clean, raw dataset to the exact cap. The presence of formulas, array operations, pivot caches, and formatting absorbs cells more quickly than raw data; this accelerates the onset of performance degradation. For most practical purposes, plan for tens of thousands of rows with moderate formulas, and reserve hundreds of thousands of cells for lean templates. The essential takeaway is: know your column count, compute the approximate row ceiling, and then stress-test with representative formulas and data samples.
If your workbook contains multiple sheets that each hold substantial data, total usable rows across all sheets will be constrained by the 10 million cell limit. Tools like the QUERY function, IMPORTRANGE, and Apps Script can help consolidate insights without duplicating data, but they also contribute to cell usage. How To Sheets recommends validating your actual capacity using a realistic data sample and then resizing or distributing data accordingly.
Real-world implications for large datasets
For students, professionals, and small business owners, the practical takeaway is clear: plan for growth, not just for today. Large datasets in Google Sheets become challenging when you approach a few hundred thousand rows, particularly if your sheet uses complex calculations or external scripts. When a single spreadsheet starts to push the 10 million cell boundary, you’ll notice slower load times, delayed recalculations, and occasionally flaky imports or exports. The risk isn’t only about hitting a hard limit; it’s about the diminishing returns on convenience as you overlap numerous features (filters, conditional formatting, data validation, charts). A well-designed workflow often distributes data across multiple sheets or even different tools (such as a lightweight database) while keeping summary dashboards in Google Sheets for accessibility.
In practice, users can gain efficiency by leveraging templates that separate raw data from analysis layers, using query-based summaries, and employing Apps Script to automate data movement. The How To Sheets team has observed that teams reduce cognitive overhead and maintain performance by separating data sources, rather than bloating a single sheet with everything.
For those who must preserve all data in Sheets for collaboration, consider implementing structured naming conventions, regular archiving, and automated checks to identify when the dataset nears capacity. A disciplined approach to data modeling ensures you continue to work within the software’s natural limits while maintaining a reliable workflow.
Strategies to manage near-limit datasets
When you approach the practical limit, several strategies can help you maintain productivity without sacrificing access to data. First, split data across multiple sheets within the same spreadsheet. Use a master sheet for summaries, and keep the raw data in separate tabs. Second, move heavy data storage to an external system (a database, BigQuery, or a data warehouse) and pull only the required slices into Sheets through QUERY or IMPORTRANGE for analysis. Third, optimize formulas and reduce usage of volatile functions like NOW(), TODAY(), and RAND() inside large ranges; replace them with static values where possible. Fourth, consider using Apps Script to automate data partitioning and archiving; this keeps the user experience snappy while maintaining access to historical data. Finally, leverage dashboards and pivot tables to present insights without loading every record in a single sheet. These techniques align with How To Sheets’ guidance on scalable data workflows and practical templates that maintain usability at scale.
Practical estimation tool and templates
A practical approach to estimating capacity starts with a simple worksheet that lists the number of columns you plan to use and the number of rows you expect to need. Create a small calculator column that computes floor(10,000,000 / columns). Use this as a planning tool when designing your data model. For example, if you anticipate 50 columns, your calculation yields floor(10,000,000 / 50) = 200,000 rows. Build templates that automatically adjust when you add columns, so you can foresee at what point you’ll exceed capacity. Consider including a “live estimate” row that updates as data is entered. How To Sheets templates encourage you to separate data capture from analytics, using FILTER and QUERY to surface the insights you need without expanding the raw data footprint.
Templates can also help you adopt a multi-sheet pattern from the start, with a standardized naming convention and a central dashboard that aggregates results. When designing these templates, lock management sheets to prevent accidental growth in the wrong area and set data validation rules to maintain data quality as you scale.
Common myths and misconceptions
A common misconception is that Google Sheets has a fixed maximum number of rows per sheet. In reality, the limitation is the total cell cap per spreadsheet. Another misconception is that performance hinges solely on row count; in truth, the complexity of formulas, conditional formatting, integrations, and scripts can drastically affect responsiveness long before you reach the cell cap. A third misconception is that you must abandon Sheets for large datasets; instead, you should adopt a hybrid approach: keep essential analysis in Sheets, and offload bulk data management to a database while maintaining a live connection for summaries. Understanding these nuances helps you design more robust workflows and avoid surprises.
Finally, some users assume that splitting data across many sheets reduces the footprint; while it can improve performance, it’s important to maintain a coherent data model and consistent references so the workbook remains maintainable and auditable. These clarifications align with How To Sheets’ research into practical, scalable Google Sheets usage.
How to monitor usage and avoid hitting limits
Monitoring starts with a straightforward audit of your sheet’s dimensions. Keep an eye on the total number of used cells and the number of columns per sheet. A weekly or monthly review of active sheets helps you gauge growth trajectories. You can implement simple checks like a running tally of non-empty cells in key tabs and alerts when thresholds approach 80–90% of the per-spreadsheet capacity. Additionally, use scripts to flag large ranges that contain heavy formulas or to suggest cleanups. Finally, maintain a habit of archiving older data to a separate spreadsheet or export file, preserving access to historical information without clogging the active workbook.
These practices—auditing, scripting, archiving—are core to a disciplined data workflow endorsed by How To Sheets analysts.
Alternatives to Google Sheets for massive data
When datasets approach or exceed practical limits in Sheets, consider complementary tools for heavy data lifting. Databases like PostgreSQL or cloud data warehouses can store millions of rows efficiently while providing robust querying capabilities. You can still perform business-friendly analyses in Sheets by importing summarized data or by connecting Sheets to a database via Google Apps Script or connectors. For teams needing real-time collaboration with large datasets, BigQuery and related BI tools offer scalable solutions. The goal is to keep Sheets as the collaboration surface and use other platforms for durable storage and heavy analytics. How To Sheets recommends a blended approach: rely on Sheets for lightweight data collection and reporting, and leverage dedicated data stores for scale and reliability.
Estimated max rows by column count under the 10,000,000-cell cap
| Scenario | Columns | Max Rows (approx) | Notes |
|---|---|---|---|
| Standard 26-column spreadsheet | 26 | 384,615 | Based on 10,000,000 cell limit |
| Narrow sheet with 10 columns | 10 | 1,000,000 | More headroom with fewer columns |
| Wide sheet with 100 columns | 100 | 100,000 | Rows drop as columns increase |
FAQ
What is the official row limit in Google Sheets?
There is no fixed row limit. The cap is the 10,000,000 cells per spreadsheet. If you know your column count, you can estimate max rows as floor(10,000,000 / columns). How To Sheets Analysis, 2026.
There isn’t a fixed row limit—it's the 10 million cell cap per spreadsheet. You can estimate rows by dividing by the number of columns.
How can I estimate max rows for my sheet?
Count the number of columns you plan to use and compute floor(10,000,000 / columns). For example, with 50 columns, max rows are about 200,000. Always test with a realistic dataset.
Count columns, divide 10 million by that, and floor the result to get max rows.
Does performance degrade before hitting the cell limit?
Yes. As you accumulate formulas, scripts, and formatting, recalculation times grow. It’s common to see noticeable slowdowns well before reaching 10 million cells.
Yes, performance often degrades before you hit the limit due to formulas and scripts.
What should I do when approaching the limit?
Split data across multiple sheets, or move bulk storage to a database while keeping analyses in Sheets. Use QUERY/IMPORT to surface needed insights.
Split data across sheets or move bulk data to a database; keep important analyses in Sheets.
Are there alternatives for very large datasets?
For very large datasets, consider databases or cloud data warehouses, and connect to Sheets for dashboards or summaries.
Yes—use a database or data warehouse for scale, and pull summaries into Sheets.
Is there a per-sheet row limit?
Google Sheets does not enforce a fixed per-sheet row limit; the overall constraint is the 10 million cells per spreadsheet.
There isn’t a fixed per-sheet row limit; the limit is across the whole spreadsheet.
“The practical limit isn’t a fixed row count; it’s the total cell cap. Design with multi-sheet layouts or external storage when data grows beyond a comfortable size.”
The Essentials
- Plan around the 10 million cells per spreadsheet.
- Estimate max rows as floor(10,000,000 / columns).
- Split large datasets across sheets or use a database for very large data.
- Use templates and dashboards to keep insight without bloating data size.