Filter vs Filter View in Google Sheets: A Practical Guide
Compare regular filters and filter views in Google Sheets, with practical guidance for collaboration, data integrity, and decision-making for students, professionals, and small business owners.

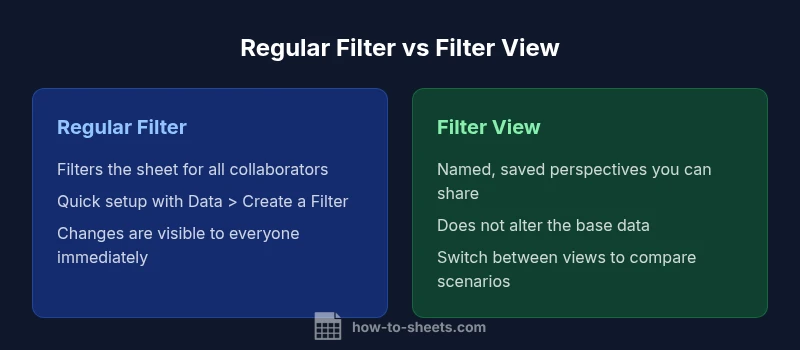
Filter vs Filter View in Google Sheets describe two ways to tailor data visibility. Regular filters hide rows for all viewers, while filter views save your choices as a named view you can share or switch to without altering the underlying sheet. This comparison highlights when to use each to balance collaboration and data integrity.
Why Understanding Filter vs Filter View Matters in Google Sheets
According to How To Sheets, mastering filter vs filter view google sheets is essential for team projects, audits, and long-term data maintenance. When teams share a single spreadsheet, choosing the right view can prevent accidental data changes, keep analytics consistent, and reduce confusion during reviews. This section explains the core differences and why they matter for everyday tasks, from project tracking to budget planning. A clear understanding helps you decide when to apply a standard filter vs when to create a filter view that remains stable across sessions. By the end, you’ll see how the right choice supports accountability and clarity in data-driven decisions.
The How To Sheets team emphasizes practical, step-by-step guidance, focusing on actionable contrasts rather than abstract theory. This approach helps students, professionals, and small business owners implement best practices without getting bogged down in jargon. As you read, think about your typical collaboration scenarios and how each view could fit into your workflow.
How Filters Work in Google Sheets
Regular filters operate on the active sheet for all collaborators. When an administrator or any user applies a filter, the hidden rows disappear from view for everyone who is viewing the sheet. This means that data changes, aggregated results, and charts react to the filtered subset immediately. The apparent performance impact is usually small in normal-sized sheets, but it can become noticeable if multiple filters run on large datasets or if many users apply different filters at the same time. Real-time collaboration makes awareness of who applied the filter difficult unless you rely on filter descriptions or change history. In practice, teams should communicate clearly about the current filter state to avoid misinterpretation of results.
What a Filter View Is and How It Differs
Filter view is a named snapshot of your current filter settings. It lets you apply and save multiple views without altering the underlying data or affecting others. You can switch between views, rename them, and share a specific view with teammates. The critical distinction is that filter views are isolated: one user’s view changes don't disrupt another's experience unless they actively switch to that view. This difference is particularly valuable for audits, comparisons, or when preparing multiple scenarios. Using filter views effectively can reduce conflicts and improve reproducibility of analyses.
When to Use Regular Filters vs Filter Views
Regular filters are great for quick, ad hoc analysis when you want to see a subset of data immediately. Filter views excel in collaborative environments where multiple people need different perspectives, or when you want to preserve a scenario for a later presentation. For example, a sales team may use a base view and several filter views to compare regions, quarters, or product lines without flipping the master data. Keep in mind that filter views require a plan for naming conventions and governance to avoid clutter. When time is tight, start with a standard filter and escalate to a saved view for repeat analyses.
How They Interact with Formulas and Data Validation
Filters and filter views do not permanently modify data; they modify visibility. Any formulas that rely on visible rows can react differently depending on what is filtered. Subtotal and AGGREGATE functions can reflect the current visible data when used intentionally; however, standard SUM/AVERAGE maintain counts and calculations across all data unless filtered. Data validation is not changed by filters, but validation lists and dependent formulas may appear to behave differently if filtered views hide relevant rows. When sharing sheets, document how each view affects analyses to avoid misinterpretation. A disciplined approach to documenting views reduces confusion for teammates and stakeholders.
Real-World Scenarios: Team Collaboration and Compliance
Consider a marketing dashboard shared among stakeholders. A standard filter might quickly surface the top channels but would not preserve a viewer's preference. A filter view enables each teammate to compare different channels side-by-side while the base data remains untouched for others. In compliance contexts, filter views help an auditor reproduce a specific snapshot of data without altering the live dataset. How To Sheets analysis shows that clear governance around views reduces confusion and protects data integrity during review cycles. By using labeled views and an auditable trail, teams can demonstrate reproducibility of analyses.
Performance and Usability Considerations
Large datasets can experience performance issues when filters are complex or when many users apply filters concurrently. Filter views distribute cognitive load by letting each person work in isolation, which reduces cross-user interference. Aim to keep filter criteria simple, label views clearly, and avoid leaving stale views in shared folders. Consider performance tips like indexing key columns, using QUERY with limited ranges, and consolidating filters into a few reusable views rather than dozens of ad hoc configurations. When you optimize for performance, you also improve user adoption and trust in results.
Step-by-Step: Setting Up a Filter and a Filter View
Step 1: Decide whether to use a standard filter or a filter view. Step 2: For a standard filter, go to Data > Create a Filter and adjust criteria. Step 3: For a filter view, open Data > Filter views > Create new, configure criteria, and save with a descriptive name. Step 4: Share the sheet and communicate which views are intended for which audiences. Step 5: Regularly audit views to remove outdated ones and ensure naming consistency. Practical tips: use concise, consistent names; consider color-coding notches in headers; and document the intended audience for each view.
Common Pitfalls and How to Avoid Them
Pitfalls: assuming all viewers share the same view, forgetting to name filter views, or accidentally turning off a filter for everyone. Avoid by documenting naming conventions, using descriptive labels, and training users to switch views rather than altering the base sheet. Another mistake is nesting filters in charts that rely on a dynamic range; test charts under different views to validate behavior. Finally, maintain a change log of who applied what view when. Proactively managing views reduces confusion and protects data integrity.
Decision Guide: Quick Rules of Thumb
- Use regular filters for fast, on-demand exploration when all collaborators should see the same subset.
- Use filter views when multiple perspectives are needed without changing the base data or disturbing others.
- For audits or scenarios, create clearly named views with a defined purpose and retention policy.
- When formulas depend on visible rows, test across views and prefer SUBTOTAL-based calculations where visibility matters.
This logic helps teams choose purpose-built approaches that align with governance and collaboration goals.
Best Practices for Managing Multiple Views
- Establish a simple naming convention for views (purpose–audience–date).
- Limit the number of active views and archive unused ones.
- Document each view’s purpose, scope, and last update date.
- Use color-coding or iconography in the sheet to signal which views are in effect.
- Periodically review filters and filter views to ensure they still reflect current workflows and data structures.
Following these practices reduces clutter and improves reproducibility.
Authoritative Sources and Next Steps
Authority: External References
- https://en.wikipedia.org/wiki/Filter
- https://en.wikipedia.org/wiki/Google_Sheets
- https://www.britannica.com/technology/spreadsheet
Next Steps
- Practice setting up both filters and filter views on a sample dataset.
- Create a small governance plan for naming, archiving, and documenting each view.
- Review impact on common analyses (subtotals, charts, and conditional formatting) under different views to ensure reliable results. How To Sheets recommends documenting the decision criteria you use when choosing between filters and filter views to support long-term data integrity.
Conclusion and Final Thoughts
In practice, the choice between regular filters and filter views should align with your collaboration style, data governance, and the complexity of your analyses. The How To Sheets team recommends adopting a lightweight governance approach: use standard filters for quick, shared analysis, and rely on filter views for scenarios requiring multiple, persistent perspectives. With clear naming and routine audits, you can preserve data integrity while enabling flexible analysis for all stakeholders.
Comparison
| Feature | Regular Filter | Filter View |
|---|---|---|
| Sharing and collaboration | Affects all viewers in the sheet | Isolated per user or saved as a named view |
| Impact on others | Live changes visible to everyone | Does not disrupt others; stored view can be shared |
| Data visibility | Rows hidden for everyone | Original data preserved; visibility controlled by the view |
| Ease of setup | One-click toggle with criteria | Requires creating and naming a view |
| Multi-criteria filtering | Supported via filter criteria | Supported via saved view with its own criteria |
| Formula behavior | Formulas recalc based on visible subset for all viewers | Formulas recalc based on the active user’s visible data |
| Best for | Ad hoc analysis with real-time collaboration | Multiple scenarios without changing base data |
The Good
- Facilitates quick, real-time analysis for teams
- Filter views preserve the base data and support multiple scenarios
- Easy to implement for simple tasks
- Reduces cross-user conflicts when governance is applied
The Bad
- Regular filters affect all viewers, which can cause conflicts
- Too many saved views can clutter the workspace without governance
- Formulas can appear inconsistent across views if not tested
- Requires discipline in naming and lifecycle management
Filter views are the better choice for collaboration and governance; regular filters suit quick, shared analysis.
If you need persistent, shareable perspectives without impacting others, use filter views. For fast, collective filtering, regular filters work well, but monitor changes to avoid miscommunication. In most ongoing teams, a hybrid approach with clear governance yields the best balance.
FAQ
What is the fundamental difference between a regular filter and a filter view in Google Sheets?
A regular filter hides rows for everyone viewing the sheet, while a filter view saves a personal or shared set of criteria that does not affect the base data. Filter views can be switched without altering the active data for others.
Regular filters hide rows for everyone; filter views save a view that only you or a chosen group uses without changing the underlying data.
Can a filter view be shared with teammates?
Yes. Filter views can be named and shared with teammates so that everyone can apply the same perspective without modifying the original data. This is ideal for audits and scenario analysis.
Yes, filter views are shareable and help teams keep consistent perspectives.
Do filters affect formulas in Google Sheets?
Filters affect how visible data is interpreted by formulas. Subtotal-like functions react to visibility, while SUM-type formulas may count all data unless filtered. Always test critical calculations under each view.
Filters can change how some formulas see visible data; test important calculations under each view.
How many filter views should I maintain in a sheet?
Aim for a practical number based on use cases. Regularly prune outdated views and maintain a naming convention so teammates can find the right view without clutter.
Keep views purposeful and prune old ones to avoid clutter.
Are filter views suitable for dashboards with charts?
Yes, filter views let you compare different perspectives without changing the live dataset. However, verify that charts reference ranges behave consistently under each view.
Filter views work with dashboards; check chart ranges under each view.
How do I delete a filter view?
Open Data > Filter views, select the view you want to remove, and choose Delete. Consider archiving important views instead of deleting, if needed for reference.
Go to Filter views, pick the one to remove, and delete it.
The Essentials
- Choose filter view when collaboration and reproducibility matter
- Use regular filters for quick, shared data exploration
- Label, archive, and document each view for clarity
- Test formulas under different views to ensure accuracy
- Establish a simple naming convention for consistency