Google Sheets Table vs Filter: Practical Comparison
An analytical guide comparing google sheets table vs filter, detailing definitions, use-cases, performance, collaboration, and best practices to help you choose the right approach for data tasks.

When deciding between a google sheets table and a filter, prioritize structure and collaboration (table) or rapid, ad-hoc analysis (filter). This quick guide highlights key differences, use-case examples, and practical tips to choose the right approach for your data task. Context matters: the same dataset may require a table for consistency across teams and filters for stakeholder-specific views.
What does google sheets table vs filter mean in practice?
In practice, the terms google sheets table and filter describe two complementary approaches to organizing data. The phrase google sheets table vs filter is common among students and professionals who want to decide whether to enforce a structured data range or rely on dynamic views. A "table" in Sheets isn’t a formal object like Excel Tables; it’s a well‑structured, header‑driven range with consistent columns that you maintain to support formulas, data validation, and repeatable reporting. A "filter" is an interactive view mechanism that narrows down visible data using criteria; it doesn’t require changes to the underlying data schema. This distinction matters for consistency, governance, and how teams collaborate. For many teams, the best route is to start with a table-like structure that enforces data types and validation, and then layer filters to support ad-hoc analysis or stakeholder-specific views. According to How To Sheets, starting with a table-first approach reduces confusion when multiple collaborators edit the same dataset. The goal is to create a foundation you can trust across dashboards, summaries, and cross-sheet analyses.
When to choose a table: strengths and limitations
Choosing a table-style structure serves long‑term data integrity and reusable analytics. A table‑like range makes it easier to copy formulas across rows, apply consistent formatting, and enforce data validation rules. It also supports named ranges, data validation, and structured references in formulas, which can simplify complex dashboards and automated reporting. However, the rigidity of a table can impede rapid experimentation. When datasets evolve—new columns, changing data types, or shifting business rules—a rigid table may require more maintenance. In short: table structures excel for governance, reproducibility, and scalability, but they demand disciplined data entry and forward planning.
When to choose a filter: strengths and limitations
Filters unlock agility and focus. A filter or filter view narrows the visible data without altering the underlying table, enabling ad-hoc analysis, scenario testing, and tailored views for different stakeholders. Filters are especially useful when teams need to switch quickly between profit centers, time periods, or product lines, without creating multiple separate sheets. The downside is that filters don’t enforce a stable data schema; if the dataset grows or columns change, you may need to adjust formulas, named ranges, or filter criteria. In dynamic environments, filters shine for speed and flexibility, but they offer less governance compared with a well‑designed table.
Data integrity and formula behavior under each approach
Data integrity benefits from a table-like structure: you can implement strict data types, data validation rules, and consistent column definitions. Formulas built on stable columns—using relative or structured references—become easier to maintain as data expands. With filters, the underlying data is still the same, but what you see can vary. This means formulas behave consistently, but visible results depend on the current filter view. If you rely on filtering for reporting, consider combining with named ranges or a separate summary sheet that aggregates visible data. The key is to separate data storage from data presentation to minimize errors and ensure reproducibility.
Collaboration and governance considerations
Collaboration benefits from a clear table structure. When multiple people edit the same dataset, a standardized table reduces confusion, enforces data types, and simplifies permissions and auditing. Filter views add collaboration by enabling role-specific perspectives without altering the base data. For example, a marketing team can filter by campaign while finance keeps the full dataset intact. The governance approach should balance table-based standardization with filter-based flexibility, accompanied by documentation and a lightweight change-log. Remember: naming conventions, documentation, and a defined process for expanding the data schema help prevent drift.
Performance and scalability with larger datasets
As datasets grow, a stable table structure often yields better predictability in performance. Large tables with consistent columns support efficient range operations, batch updates, and scalable formulas. Filters, by contrast, can reduce the cognitive load of analysis but may not reduce the actual data processed by Sheets under the hood. If you routinely work with millions of rows, you may need to consider data modeling techniques outside of Sheets—for example, importing subsets into dedicated views or using query functions to summarize data. The takeaway: plan for growth by prioritizing a robust table foundation and reserving filters for exploratory work.
Practical workflows: combining tables and filters
A practical workflow frequently blends both approaches. Start with a table that defines the canonical data schema: header row, consistent data types, and data validation rules. Then, create filter views to support department-specific analyses (sales, marketing, operations) or time-based views (monthly, quarterly). When preparing dashboards, pull summarized results from the canonical table using formulas or the QUERY function, while leaving the underlying data intact. This separation of data storage and presentation yields reliable, auditable reports and flexible analysis. To succeed, map each view to a defined purpose and ensure changes to the schema are communicated in a central document.
Common mistakes to avoid
Common pitfalls include treating a filter as a substitute for good data governance, over-relying on ad‑hoc views when data structure has drifted, and neglecting data validation and documentation. Another frequent issue is failing to update formulas that reference expanded or renamed columns after schema changes. Additionally, users sometimes create multiple parallel sheets with slightly different table structures, which fragments the data model and complicates maintenance. A disciplined approach—clear headers, consistent formats, and versioned change notes—minimizes these mistakes.
Step-by-step setup: creating a table-like structure and enabling filters
Step 1: Plan your data schema with a clean header row and explicit data types for each column. Step 2: Format the range for readability (alternating colors, bold headers) and apply data validation where appropriate. Step 3: Use named ranges or a dedicated sheet for raw data to simplify references in formulas. Step 4: Apply a filter (Data > Create a filter) to enable quick subset analysis, and save reusable filter views for common scenarios. Step 5: Build dashboards or summaries on a separate sheet (e.g., using QUERY or SUMIF) that pull data from the canonical table, ensuring that the base data remains unchanged. Step 6: Document the structure, validation rules, and filter views so teammates understand how to extend the dataset without breaking the model.
Decision checklist and quick-start guide
- Do you need strong data governance and repeatable analyses? Favor a table approach.
- Do you require fast, ad-hoc exploration by multiple stakeholders? Add filter views.
- Is the dataset subject to frequent schema changes? Plan for schema management and versioning.
- Do you need dashboards that scale across sheets? Build on a stable table foundation and reference it in your visuals.
- Have you documented rules and validated inputs? If not, start there to reduce future maintenance overhead.
Comparison
| Feature | google sheets table | filter |
|---|---|---|
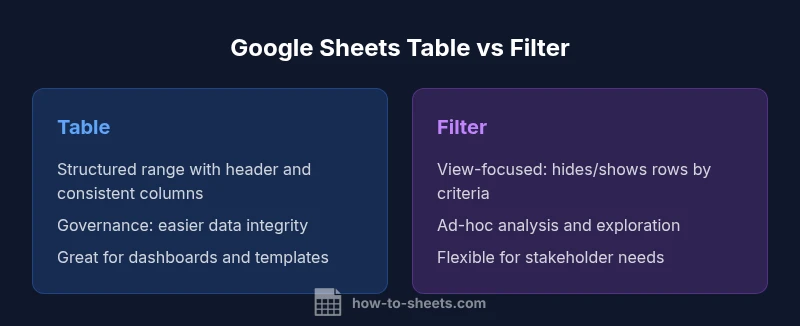
| Definition/Scope | Structured range with header, consistent columns, and governance cues (not a formal Excel-style table feature) | View-based subset of rows/columns controlled by criteria; underlying data remains unchanged |
| Data integrity & formulas | Supports data validation, consistent data types, and easier formula maintenance across rows | Formulas stay tied to data; filter visibility does not affect data integrity but can change what you see |
| Best use case | Dashboards, templates, and repeatable data entry with standardized schemas | Ad-hoc analysis, scenario testing, and stakeholder-specific views without altering data |
| Performance & scalability | Better for stable schemas and large data with consistent columns | Filters help focus analysis but do not reduce underlying data processing |
| Collaboration & sharing | Standardized structure improves governance and cross-team collaboration | Multiple filter views enable personalized analyses while preserving the base data |
| Impact on data workflow | Enables repeatable templates and dashboards; easier maintenance for formulas | Promotes fast exploration; ideal for iterative decision-making without schema changes |
The Good
- Promotes data consistency and governance when you standardize a table-like range
- Eases use of formulas across a stable dataset
- Supports dashboards, pivot tables, and repeatable templates
- Filters enhance viewing flexibility without altering data
The Bad
- Requires discipline to maintain structure; not as flexible for dynamic experiments
- Can feel rigid for rapid, ad-hoc analyses
- May require extra steps to set up filters and views without changing the base table
Tables generally provide stronger governance and consistency; filters excel for flexible, ad-hoc analysis
For most teams, start with a well-structured table to establish data integrity. Layer filters for stakeholder-specific views and quick analysis without altering the base data. A blended approach yields the best balance between reliability and agility.
FAQ
What is the essential difference between using a table and a filter in Google Sheets?
A table refers to a structured data range with a header and consistent columns, enabling governance and formulas. A filter is a view-based tool that shows only rows or columns meeting criteria, without changing the underlying data structure.
A table is a structured data range with headers, while a filter hides or shows data based on criteria without altering the data itself.
Can I apply a filter to a table without losing data?
Yes. Filters hide rows that don’t meet criteria but do not delete or modify the underlying data. You can always clear the filter to reveal all data again.
Yes, filters hide data based on criteria but nothing is deleted.
How do I switch from a filter view to a table approach?
Convert your data range into a headered, consistently formatted region. Add data validation and named ranges to enforce structure, then use filters for ad-hoc views as needed.
Make the range structured with a header, then add validation and names for stability.
What is better for dashboards and automation?
Tables are generally better for dashboards and reusable templates; filters help tailor views for different stakeholders without changing data. A dashboard built on a solid table base tends to be more scalable.
Tables for dashboards, filters for tailored views.
Are there best practices to avoid common mistakes?
Yes. Use a header row, keep data types consistent, and apply data validation. Document filtering criteria and maintain a central changelog when the schema evolves.
Keep headers, consistent data, and document filters.
Where should a beginner start with Google Sheets?
Begin with a clean, table-like range. Practice applying filters, then learn to build summaries with formulas that reference the canonical table.
Define a clean header and range, then explore filters.
The Essentials
- Define a clean header and standardized data types
- Use filters for ad-hoc views while maintaining a canonical table
- Document schema, validation rules, and filter views
- Leverage formulas on stable table columns for dashboards
- Blend both techniques for flexible, scalable workflows