Google Sheets, Docs & Slides: Integrated Workspace Guide
Learn how to connect Google Sheets with Docs and Slides for seamless data-driven documents and presentations. Follow practical steps, templates, and automation ideas to boost collaboration and efficiency.

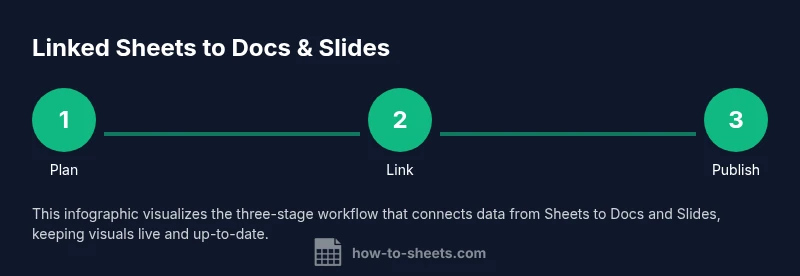
Learn to streamline data across google sheets docs slides. This guide shows how to plan, connect, and present live data between Sheets, Docs, and Slides, with templates, step-by-step actions, and automation ideas. By the end, you'll produce data-driven documents and dynamic presentations that update automatically as your data changes.
The Google Docs, Sheets, and Slides Ecosystem: A Quick Overview
In today’s collaborative workspace, google sheets docs slides form a powerful trio that bridges numbers, words, and visuals in one browser-based environment. When you think about how to work with google sheets docs slides, imagine a living data network that flows from raw numbers in Sheets to narrative content in Docs and polished visuals in Slides. This section provides a practical orientation for students, professionals, and small business owners who want to reduce manual copy-paste and unlock real-time updates. According to How To Sheets, the Sheets–Docs–Slides trio unlocks seamless data-to-presentation workflows that scale from simple lists to multi-page reports. The How To Sheets team found that keeping data live across apps dramatically reduces data drift and rework, especially in team-heavy projects. By understanding the roles of each app, you can design workflows that minimize friction and maximize clarity. The aim is not to master every feature at once, but to adopt a few high-leverage practices that you can reuse across projects.
Key idea: treat Sheets as your data engine, Docs as your narrative hub, and Slides as your visuals engine. By aligning data structure, templates, and automation, you create a fluid pipeline where updates propagate through the document lifecycle without tedious re-entry. This approach works well for reports, dashboards, project briefs, and teaching materials. As you start, keep your goals clear: what story should the data tell, and who needs to see it?
Why Integrate Sheets with Docs and Slides?
Integrating Sheets with Docs and Slides enables a single source of truth. Instead of exporting data or recreating charts for every document, linked content updates automatically, saving time and reducing errors. This approach also improves collaboration: team members can edit the data in Sheets while writers and designers focus on Docs and Slides, all within the same Google Workspace environment. For students, instructors, and small business owners, the workflow translates to faster reporting, more persuasive presentations, and consistent branding across documents.
From a practical perspective, you gain three core benefits: (1) live data in narrative and presentation formats, (2) standardized templates that scale across projects, and (3) streamlined approvals since the data remains in one place. When you start with a simple dataset and a basic Docs template, you’ll soon see the value of a live-link architecture that keeps content fresh even as numbers shift. The goal is to minimize manual re-entry while maintaining control over formatting and storytelling.
As you adopt these integrations, prioritize data governance: who can edit the data, how changes are tracked, and how updates propagate to Docs and Slides. A clear process reduces confusion and protects your work from accidental changes. The result is a cohesive, scalable workflow that aligns analytics with narrative and visuals.
Practical Use Cases: When to use Sheets alongside Docs/Slides
There are many scenarios where Sheets, Docs, and Slides work better together than separately. Here are representative use cases to guide your implementation:
- Financial reporting: Maintain a live budget or expense tracker in Sheets, then generate a monthly narrative report in Docs and a quarterly slide deck in Slides with updated charts.
- Academic projects: Store experimental results in Sheets, draft a methods and results section in Docs, and create a summary presentation in Slides that reflects current data.
- Client briefs and proposals: Pull performance metrics from Sheets into a Docs proposal and a Slides deck for quick client delivery. Templates ensure branding consistency across documents.
- Dashboards and executive summaries: Publish a live dashboard in Sheets, then reference key metrics in Docs and Slides for executive-readiness. This reduces the need to copy data into multiple files.
In each case, the data remains centralized in Sheets while Docs and Slides act as adaptive canvases for narratives and visuals. The result is faster turnarounds, fewer errors, and clearer communication with stakeholders. To maximize value, define the target audience and the decision points the documents must support, then tailor data visibility and visualization accordingly.
Core Features to Leverage Across Apps
Google Workspace offers features that make cross-app integration practical and reliable:
- Linked charts and tables: Embed live charts from Sheets into Docs and Slides. When the underlying data changes, the visuals update automatically, ensuring your presentations stay current without manual edits.
- Named ranges and data validation: Use named ranges to simplify references when linking data across apps. Data validation helps maintain data integrity as more collaborators contribute.
- Templates and placeholders: Create Docs templates and Slides master decks with placeholders that are bound to Sheets data. This reduces repetitive formatting and ensures consistency.
- Dynamic charts in Docs: Insert charts that pull from Sheets, allowing narrative sections to reflect current metrics alongside context.
- Apps Script and add-ons: For more advanced automation, Apps Script can trigger data refreshes, convert Sheets data to Docs or Slides, and schedule updates. Use add-ons carefully to avoid performance bottlenecks.
Tip: Start with a small pilot project to validate the linking workflow. Expand to larger datasets and more complex visuals after you confirm the process is reliable and easy for teammates to adopt. This reduces risk and accelerates adoption across teams.
Step-by-Step: Creating a Live Data-Driven Presentation (Sheets → Docs/Slides)
A live, data-driven presentation requires careful planning and careful execution. The following narrative introduces the core steps and rationale behind them, setting the stage for the formal STEP-BY-STEP section that follows. By understanding the rationale behind each action, you’ll be better prepared to troubleshoot issues and tailor the workflow to your organization’s needs. The emphasis is on building a repeatable pattern: plan the data model, create templates, link content, and automate refreshes while preserving control over formatting and access.
First, define the data you need to convey and map it to a Sheets layout with headers, data types, and relationships. Then, design a Docs template that can host both narrative content and embedded visuals. Finally, assemble a Slides deck that references the same data sources to maintain consistency. With these foundations, you’ll be able to produce a cohesive, data-driven story that travels smoothly from Sheets to Docs and Slides. The rest of this guide provides concrete steps and best practices to bring this vision to life.
Tips for Streamlined Workflows with Google Workspace
- Plan data flow before building templates: Sketch how data moves from Sheets to Docs and Slides. A clear data flow diagram prevents misreferences and missing links.
- Use named ranges for reliability: Named ranges are easier to update than hard-coded cell references. They improve readability and reduce errors when data changes.
- Version control and staging: Work on copies when experimenting with new links or automation. Use Drive’s version history to revert changes if needed.
- Test with a sample dataset: Before deploying a live workflow, test the end-to-end process with mock data to catch edge cases early.
- Document your process: Create a short internal guide describing who can edit links, how updates propagate, and how to troubleshoot common issues. This reduces onboarding time for new teammates.
Pro tip: Keep the data model simple at first and gradually expand. Complex interdependencies are harder to maintain and more prone to breakage during updates.
Common Pitfalls and How to Avoid Them
- Overly complex linking: Avoid dozens of interdependent links in a single project. Start with a few core links and scale up as you gain confidence.
- Breaking templates during edits: Always test changes in a copy before applying them to production documents and decks.
- Inconsistent data formats: Use consistent data types and formatting in Sheets to prevent misinterpretation in Docs and Slides.
- Permission drift: Regularly review sharing settings to ensure collaborators have appropriate access levels and avoid accidental data exposure.
- Update timing issues: When using live links, plan for refresh timing and avoid publishing at a moment when data is in flux. Consider scheduling updates during off-peak hours.
Avoiding these pitfalls will lead to more stable, scalable workflows and fewer last-minute surprises during reporting cycles.
Advanced Tactics: Automating Updates with Apps Script and ImportRange
Automation can dramatically reduce manual work but requires careful design. Apps Script can refresh linked content in Docs and Slides on a schedule or in response to Sheets changes. For example, you can trigger a script on a time-based schedule to re-import key charts or tables into Docs and Slides, ensuring visuals stay current. If you prefer a declarative approach, IMPORTRANGE can keep a sheet synchronized across multiple files, but be mindful of permissions and data exposure when sharing linked data.
When adopting advanced tactics, start with a small automation and validate results. Document the script’s behavior and include error handling so that the automation fails gracefully. Avoid creating circular references or heavy scripts that degrade performance in large spreadsheets. With proper planning, Apps Script and ImportRange can provide powerful, low-maintenance live data pipelines across Sheets, Docs, and Slides.
Case Study Scenarios: Small Business and Student Projects
- Small business scenario: A regional sales team uses Sheets to track monthly revenue by product and region. A Docs template auto-populates a narrative quarterly report with top-line metrics, while a Slides deck presents the same KPIs with linked charts. The workflow reduces the time from data collection to stakeholder presentation and ensures all materials reflect the latest numbers.
- Student project scenario: A class tracks experimental results in Sheets, writes a methods and results section in Docs, and creates a final presentation in Slides. As root data changes during experiments, the reporting documents update automatically, enabling faster iteration and clearer communication with instructors.
In both cases, the integration leverages a consistent data model, shared templates, and automated updates to keep content aligned. This reduces manual work and improves accuracy, while empowering teams and students to focus on interpretation and storytelling rather than data wrangling.
Tools & Materials
- Google account with access to Google Drive(Essential for all integrations.)
- Reliable internet connection(For real-time syncing across apps.)
- Draft data schema (headers and data types)(Plan columns, data types before building templates.)
- Docs and Slides templates(Templates to host data and visuals.)
- Linked charts or sample data in Sheets(Examples to test linking.)
- A sample dataset (CSV or Google Sheet)(For demonstration and testing.)
- Apps Script editor (optional)(For advanced automation.)
- Version control (Google Drive versions)(Keep safe before major changes.)
Steps
Estimated time: 60-90 minutes
- 1
Plan data model in Sheets
Outline the data you will capture, including headers, data types, and relationships. Create a simple schema that future extensions can reuse. This planning reduces rework when you publish to Docs and Slides.
Tip: Draw a quick data-flow diagram showing how each field will be used in Docs and Slides. - 2
Create a Sheets dataset
Set up the spreadsheet with defined headers, sample data, and named ranges that will be referenced in Docs and Slides. Validate data types and formatting to prevent downstream errors.
Tip: Use named ranges for stable references; update the ranges rather than editing cell references in templates. - 3
Set up a Docs template
Create a Docs document with sections for narrative content and placeholders for linked content. Keep a consistent layout and branding to ensure a professional appearance across reports.
Tip: Place a dedicated placeholder for each linked chart or table to simplify automatic updates. - 4
Link Sheets data to Docs
Insert charts or tables from Sheets into Docs using the Insert menu. Ensure links are live so updates reflect in the doc as data changes.
Tip: Test a small chart first to verify that the link refreshes correctly when the data changes. - 5
Build a Slides deck linked to Sheets
Create slides that reference the same Sheets data (charts or tables). Maintain a consistent visual language with your Docs template for a cohesive story.
Tip: Add speaker notes or captions that describe the data story for each slide. - 6
Automate updates with scripts
Leverage Apps Script or simple formulas to refresh content on a schedule or in response to data changes. Keep automation lightweight to avoid performance issues.
Tip: Start with a one-hour push per week to monitor automation results and adjust as needed. - 7
Share and protect
Set appropriate sharing settings for the Sheets, Docs, and Slides assets. Use permissions and version history to control who can edit the data and who can view the output.
Tip: Create a copy or a template for onboarding new collaborators to prevent accidental edits to the live data.
FAQ
Can I link data from Sheets to Docs and Slides at the same time?
Yes. You can link the same Sheets data to both Docs and Slides so that narratives and visuals stay synchronized. Use the Insert menu to add charts and tables from Sheets into each document or slide deck. If you update the data in Sheets, the linked content will refresh in Docs and Slides according to your settings.
You can link the same Sheets data to Docs and Slides and keep them synchronized so your reports and presentations stay current.
How do I keep linked data up to date in Docs and Slides?
Linked content updates automatically when the source data changes. For more control, set a refresh schedule or use Apps Script to trigger updates after edits. Always validate that the linked visuals reflect the latest data before presenting.
Linked content updates automatically; you can also set up scheduled refreshes if needed.
Is offline access supported for linked documents?
Offline access in Google Docs, Sheets, and Slides is available, but live linking requires an internet connection. You can work offline and sync changes later; ensure you reopen the documents to trigger re-sync when online.
You can work offline, but live links require internet to refresh.
Can I automate updates with Apps Script?
Yes, Apps Script can automate data refreshes or generation of linked content across Docs and Slides. Start with a simple trigger and gradually add complexity while respecting quotas and performance.
Apps Script enables automation of updates across Sheets, Docs, and Slides.
What permissions are needed for collaborators?
Collaborators typically need edit access to Sheets and proper sharing settings for Docs and Slides. Use Drive permissions and version history to manage changes and protect the integrity of linked content.
Set appropriate edit permissions and use version history to manage changes.
Watch Video
The Essentials
- Plan data flow before building templates
- Use named ranges for reliability
- Link data across Sheets, Docs, and Slides
- Test updates with a copy before publishing
- Protect data with clear permissions and version control