Make Chart in Google Sheets: A Practical Step-by-Step Guide
Learn how to make charts in Google Sheets with a practical, step-by-step guide. From data prep to chart customization, this educator-friendly tutorial helps students, professionals, and small teams visualize data effectively and confidently.

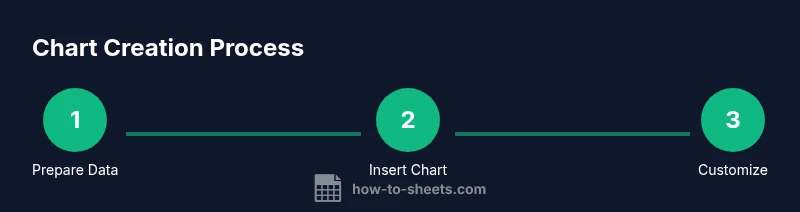
You will learn how to make a chart in Google Sheets, from selecting data to customizing the chart for clarity. This guide covers choosing the right chart type, inserting the chart, adjusting data ranges, and formatting titles, axes, and colors. By the end, you’ll have a ready-to-share chart that updates automatically when your data changes.
Why Charts Matter in Google Sheets
According to How To Sheets, turning raw numbers into visual charts makes data easier to understand, share, and act on. When you make chart google sheets, you create a visual story that highlights trends, comparisons, and outliers in seconds. Charts are not decoration; they enable quicker decisions in classrooms, small teams, and client projects. A good chart reduces cognitive load by guiding the viewer through the data without requiring lengthy explanations. In this block we cover the fundamentals: what charts can reveal, how chart choice shapes interpretation, and how to structure your data so a chart accurately reflects it. The aim is not to overwhelm you with options, but to give you a reliable workflow you can apply to most datasets. With the right setup, you’ll go from messy numbers to clear visuals that support your message in meetings, reports, and slides. Using consistent headers, clean headers, and numbered data helps the Chart Editor infer relationships more accurately. And finally, think about your audience: tailor colors and legends to improve comprehension for non-technical viewers.
Data Prep: Getting Your Data Ready
Before you can chart, your data must be clean and well organized. Start with a single table where each column is a variable and each row is a case. Make sure the first row contains headers, because the Chart Editor uses these labels for axes and legends. Avoid merged cells in the data range used for the chart, as merged cells can mislead the chart engine or create awkward label wrapping. Ensure numbers are stored as numeric data, not as text (use value formatting or convert with VALUE()). If you plan to filter later, set up a named range or a defined data range to keep the chart synchronized. How To Sheets analysis shows that consistent data structure reduces time spent adjusting charts later and makes it easier to update the chart when new data arrives. Also, consider adding a small summary row or a separate data table for calculated metrics (percent changes, averages) so your chart remains focused on the primary data.
Choose the Right Chart Type for Your Data
Different data stories require different visuals. Use a column or bar chart to compare categories, a line chart to show trends over time, a pie chart to illustrate proportions, or a scatter plot to reveal relationships between two variables. If you have multiple series, consider a combo chart to highlight complementary trends. Remember that the simplest chart that communicates your point is usually best; avoid stacking too many variables into one chart, which can confuse viewers. For data with time on the horizontal axis, ensure the axis treats dates chronologically and that gaps are handled gracefully. How To Sheets emphasizes starting with a neutral palette and adjusting only a few colors to maintain readability.
The Chart Editor: Where to Make Changes
The Chart Editor panel is your control center. In the Setup tab, pick the type, adjust the data range, and specify which columns map to which series. The Data tab lets you refine the range and add or remove data series. The Customize tab is where you tailor aesthetics and labels: chart & axis titles, legend position, font choices, gridlines, and data labels. If your data changes, the editor updates automatically, but you may need to reselect the range to capture new rows or columns. A practical tip is to name the data range (Data > named ranges) so you can pivot the chart without hunting for the correct cells each time.
Customize Your Chart for Clarity
Titles and axis labels are essential for context. Use a concise chart title that answers the question your chart addresses, and label the horizontal and vertical axes with units where relevant. Choose a legible font size and consider bolding the axis titles for emphasis. Color should distinguish series without overwhelming the viewer; aim for colorblind-friendly palettes and ensure the legend is visible but not intrusive. If you publish the chart in a document or slide, keep the legend on the side rather than overlapping data. Data labels can clutter a chart, so use them sparingly and only where precise values improve understanding. Finally, adjust the chart size to fit the available space and align it with nearby visuals for a cohesive report.
Practical Examples: When to Use Each Chart Type
Use a column chart to compare quarterly sales across regions; a line chart works well for monthly trends; a pie chart is ideal for showing market share; a bar chart is great for ranking categories side-by-side; a scatter plot reveals correlation between two metrics. For dashboards, combine charts with slicers and filters to allow viewers to explore different views without changing the underlying data. When presenting to stakeholders, start with a high-level chart and add detail as questions arise. If your dataset grows, consider creating a separate sheet dedicated to charts so your data remains pristine.
Common Pitfalls and How to Avoid Them
Avoid mixing scales across multiple charts; inconsistent y-axes can mislead readers. Don’t cram too many data series into one chart; limit to 2–4 for readability. Steer clear of busy color schemes and tiny fonts that hinder legibility. Make sure your data ranges stay synchronized when adding new data; otherwise charts may omit recent values. Lastly, always test your chart with a peer audience to catch ambiguous labels or confusing legends before sharing broadly.
Advanced Tips: Dynamic Charts and Dashboards
For dynamic charts, use named ranges, FILTER functions, or QUERY to keep the chart synchronized with live data. Create a small dashboard in Google Sheets by placing multiple charts on a single sheet with consistent styling and a single control (like a slicer) to filter data globally. If you need to share with others, enable link sharing and consider publishing the chart to a web-friendly format so stakeholders can view the latest version without editing the underlying data. Remember to document the data source and any transformations used in the chart’s notes section for future readers.
Accessibility and Sharing: Make charts usable for everyone
Design charts with accessibility in mind: choose high-contrast color combos, provide alternative text when embedding charts, and keep labels concise and readable. If you’re sharing via Google Docs or Slides, use the “Link to spreadsheet” option to keep data up-to-date. For printed reports, export charts as high-resolution images with vector quality to preserve clarity. Finally, include a short, plain-language caption that explains the chart’s purpose and key takeaway so audiences who skim can still grasp the message.
Tools & Materials
- Google account with access to Google Sheets(Ensure you are logged into your Google Drive.)
- Sample dataset (CSV or Sheets data)(Headers preferred; include numeric columns for charts.)
- Device with internet access(Browser or mobile app compatible with Google Sheets.)
- Color palette reference (optional)(Use accessible colors for readability.)
Steps
Estimated time: 10-15 minutes
- 1
Select Data
Highlight the cells that contain the data you want to chart, including headers if you plan to use them as labels. Double-check that the range covers all categories and values you intend to chart.
Tip: Use Ctrl/Cmd + Shift + Down/Right arrows to select large blocks quickly. - 2
Insert Chart
Go to Insert > Chart. A chart will appear on the sheet and the Chart Editor panel will open on the right side.
Tip: If no chart appears, try switching to a different data range or reopen the sheet. - 3
Choose Chart Type
In the Chart Editor, switch to the Setup tab and pick the chart type that best matches your data story. Start with the recommended option and adjust from there.
Tip: For quick starts, rely on the Editor’s recommended chart as a baseline. - 4
Adjust Data Range and Series
If needed, edit the Data range field to include or exclude columns. Add or remove data series so each line or bar represents a meaningful variable.
Tip: Ensure all series share the same category axis to avoid misalignment. - 5
Format Title and Labels
Add a descriptive chart title, label the axes with units, and consider formatting numbers for readability. Keep the font legible and consistent with the rest of the document.
Tip: Avoid overly long titles; keep labels concise. - 6
Finalize and Share
Move or resize the chart to fit your layout, then copy into Docs or Slides or share the sheet with collaborators. Link charts to keep data synchronized when values change.
Tip: If embedding elsewhere, test the live link to ensure updates propagate.
FAQ
Do I need headers in my data to chart in Google Sheets?
Headers are recommended because the Chart Editor uses them to label axes and data series. If your data has headers, charts are easier to interpret and update.
Yes—headers help label axes and series, making charts clearer.
Can I change the chart type after creating it?
Yes. You can switch to a different chart type anytime in the Chart Editor without recreating the chart.
Absolutely, you can switch chart types anytime.
How do I make a chart update when data changes?
Google Sheets charts are linked to their data ranges; as you edit values, the chart updates automatically.
Charts update automatically as you edit data.
Why isn't my chart showing all data?
Check the selected data range, ensure there are no hidden rows or columns, and verify that filters aren’t excluding values.
Inspect the range and any filters to ensure all data is included.
Can I embed Google Sheets charts into Google Docs or Slides?
Yes. You can copy and paste a live chart into Docs or Slides, or link it so updates reflect in the other apps.
You can embed or link charts in Docs and Slides.
What if I need a dynamic dashboard in Sheets?
Combine charts with slicers, filters, and dashboards, keeping data changes reflected across visuals.
Use slicers and dashboards for dynamic views.
Watch Video
The Essentials
- Plan your chart around a clear question
- Choose the correct chart type for your data
- Label titles and axes clearly for quick understanding
- Keep the data range dynamic for automatic updates
- Ensure accessibility with color contrast and readable text