How to Insert Shape in Google Sheets: A Practical Step-by-Step Guide
Master how to insert shape in Google Sheets for annotations and diagrams with practical steps on drawing, layering, styling, and printing.

You can insert shape in Google Sheets to annotate data, map diagrams, or build dashboards. This guide covers how to use Drawings, place and resize shapes with cells, style borders and fills, and ensure shapes print cleanly. Follow these steps to add visual cues that clarify your data without leaving Sheets.
What does inserting a shape in Google Sheets accomplish?
Inserting a shape in Google Sheets is a practical way to add visual context directly onto your data. A well-placed shape can highlight key figures, annotate a chart, or create a callout for a note, all without leaving Sheets. When you know how to insert shape in google sheets, you unlock a simple method to improve communication in dashboards, reports, and collaborative workbooks. Shapes act as anchors for text boxes, arrows, and icons, making complex datasets easier to follow. The Drawings tool, embedded into Sheets, keeps diagrams tied to the data so teammates see the same visuals. Use shapes to bracket a data range, point to a trend, or emphasize a threshold. With practice, you’ll create clean, readable visuals that enhance understanding during reviews and presentations. This is especially helpful for students, professionals, and teams that rely on quick, on-sheet annotations.
Supported shapes and limitations
The Google Drawings canvas supports common geometric shapes (rectangles, ovals), arrows, and callouts, plus lines for connectors. These objects can be pasted into Sheets as a single drawing, and you can edit them by reopening the Drawing editor from the sheet. Remember that shapes are floating objects; they don’t modify the underlying data or formulas, but they can obscure cells if not placed carefully. The primary limitation is that you can’t apply complex data-driven formatting to a shape—the styling stays within the drawing canvas. For most uses, plan the shape’s size, color, and placement before embedding it in Sheets, then adjust after insertion as your sheet evolves.
Quick-start: insert a basic shape using the Drawing tool
To begin, go to Insert > Drawing > New. In the Drawing window, pick a shape (rectangle, oval, arrow, or callout) and drag on the canvas to draw. Use the handles to resize, and switch to the fill color and border options to match your theme. When you’re satisfied, click Save and Close. The shape will appear on your sheet as an image that you can drag, resize, and align with cells. This basic workflow is the foundation for more complex annotations and diagrams in Sheets.
Aligning shapes with cells and data
After inserting a shape, align it with the relevant cells by dragging the shape until its edges align with gridlines or data boundaries. Use the corner handles to resize proportionally, and use the position keys (arrow keys) for fine-tuned movement. If you’re building dashboards, place shapes to mimic borders around key figures or to connect data points with arrows. Remember that large shapes can cover important data, so keep a balance between clarity and readability. If you need precise alignment, consider temporarily toggling gridlines on and off while positioning.
Styling and text inside shapes
Double-click the shape to edit its text content. You can add a concise label or a short note directly inside the shape, then adjust font size, weight, and color for legibility. In the Drawing editor, apply a fill color with appropriate transparency to let underlying data show through. Border color and thickness can emphasize the shape’s importance without overwhelming the sheet. For consistent visuals, reuse a small set of color swatches and line styles across your shapes. Remember: minimalism often beats complexity when annotating data.
Linking shapes with data: annotations, arrows, and callouts
Use arrows and callouts to point to specific data points or thresholds. In the Drawing tool, draw a connector line from a shape to a data point, or place a separate callout near a chart caption. You can layer multiple drawing objects by Bring to front or Send to back, so your annotations stay visible over charts and tables. When diagrams involve multiple shapes, group related elements mentally by color or border style and keep consistent spacing to preserve readability. If your sheet grows, periodically recheck alignment to ensure everything stays tidy.
Printing and sharing: preserving shapes in Sheets
Shapes inserted via Drawings embed with the sheet and should print alongside data when you use the standard print settings. For best results, test a print preview to ensure shapes aren’t cropped and that borders stay crisp on the page. If you export to PDF, confirm that the drawing scaling matches your sheet dimensions. When sharing, remember that collaborators will see the same embedded drawing, so avoid overloading the sheet with many shapes. A few well-placed visuals can significantly improve audience understanding.
Practical templates: dashboards and student worksheets
Incorporate insert shape in google sheets into dashboards by surrounding KPI blocks with subtle frames, adding arrows to guide attention, or placing callouts next to charts. For student worksheets, use shapes to highlight instructions, annotate sample data, or create simple flow diagrams showing steps in a process. Shapes can also serve as legend boxes for color-coded data series. By keeping shapes consistent in color and placement, your templates become intuitive and scalable across projects.
Tools & Materials
- Google Sheets account(Ensure you're signed in and have editing access to the target sheet.)
- Drawing tool (Insert > Drawing > New)(Used to create and insert shapes into Sheets.)
- Mouse or trackpad for precise placement(Precise dragging helps align shapes with cells.)
- Color palette and font choices(Optional enhancements to improve readability.)
Steps
Estimated time: 25-40 minutes
- 1
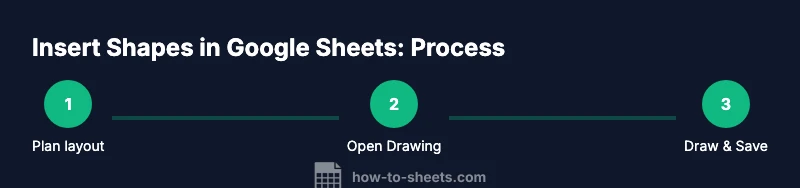
Plan layout and placement
Open your sheet and decide where shapes will sit to annotate data without obscuring key figures. Draft a quick plan in a separate tab if helpful. This reduces rework later.
Tip: Sketch placement on paper or a draft tab before drawing. - 2
Open the Drawing tool
Go to Insert > Drawing > New to access the Shapes canvas. This creates a standalone canvas where you’ll craft your shape.
Tip: Keep the canvas sized so that you can visualize final placement in Sheets. - 3
Choose and draw a shape
Select a shape (rectangle, ellipse, arrow, or callout) and draw it on the canvas to your desired size. Use the grid as a rough guide.
Tip: Hold Shift to constrain proportions for rectangles and circles. - 4
Resize and position
Use the corner handles to resize, and drag the shape toward its final position on the sheet after saving.
Tip: Zoom in to fine-tune alignment with cells. - 5
Add text inside the shape
Double-click the shape to edit its text. Keep wording concise and legible with a clear font size.
Tip: Limit text length to avoid crowding the shape. - 6
Style the shape
Apply fill color, border color, and border thickness. Use transparency to let data show through where needed.
Tip: Create a small, consistent color palette for all shapes. - 7
Embed into the sheet
Click Save and Close to insert the drawing. The shape will appear as an object you can drag, resize, and stack.
Tip: If you need to adjust later, right-click the shape and reopen the Drawing editor. - 8
Test print and adjust
Run a print preview to confirm shapes print cleanly. Adjust sizing and placement if any elements are cropped.
Tip: Turn gridlines off for a cleaner print look if needed.
FAQ
Can you insert shapes directly without the Drawing tool?
No, Google Sheets relies on the Drawing tool to create shapes. You insert the resulting drawing into Sheets as a single object. This keeps shapes visually integrated with the data.
Shapes in Sheets come through the Drawing tool; you insert them as a drawing object.
Can shapes be edited after insertion?
Yes. To edit, select the shape and reopen the Drawing editor via Edit > Edit drawing, or right-click the shape and choose Edit. Changes update the embedded object on the sheet.
You can re-open the drawing to edit the shape and text, then save again.
Do shapes affect formulas or cell data?
Shapes do not alter cell data or formulas. They are floating objects layered over the sheet. They can be moved or layered without changing underlying data.
Shapes don’t change your data; they just sit on top of the sheet.
How do I align shapes for printing?
Test print or export to PDF to verify alignment. Adjust shape size and position if needed, and consider hiding gridlines for a cleaner printout.
Print previews help you adjust shapes so they print clearly.
Can shapes be shared with others in a shared sheet?
Yes. The embedded drawing is part of the sheet and will appear for collaborators. Ensure you have editing permissions to modify the drawing when needed.
Your teammates will see the same shapes when they open the sheet.
Watch Video
The Essentials
- Plan placement before drawing
- Insert shapes via Drawing for direct Sheets integration
- Style for readability and consistency
- Align with data for clear dashboards
- Test print/sharing to ensure visibility