Google Sheets Chore Chart: Step-by-Step Guide
Create a practical Google Sheets chore chart that tracks tasks, assigns responsibilities, and shows progress at a glance. This step-by-step guide delivers a reusable template for families, classrooms, or small teams.

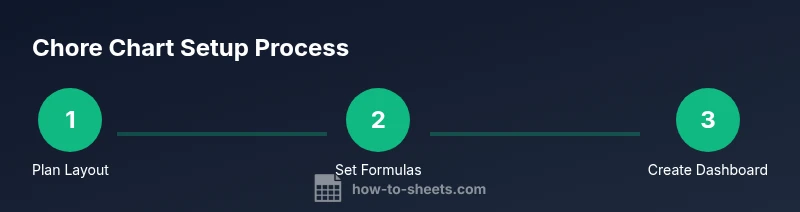
By the end, you will build a reusable Google Sheets chore chart that tracks tasks, assigns responsible people, and shows status at a glance. You’ll learn practical layout, essential formulas, and simple conditional formatting to highlight overdue items. The result is a scalable template you can adapt for families, classrooms, or small teams.
Why a Google Sheets chore chart saves time
In households, classrooms, and small teams, chores and tasks can pile up, leading to missed deadlines and frustration. A well-designed chore chart in Google Sheets provides a single source of truth, visibility, and accountability. According to How To Sheets, a practical chore-tracking solution should be simple to maintain, easy to share, and flexible enough to adapt to changing responsibilities. The keyword google sheets chore chart signals a living document that can grow with your needs.
This guide introduces a pragmatic approach to building a reusable template that suits week-by-week schedules, rotating duties, or project-related tasks. You will learn how to structure the sheet, what formulas automate checks, and how to format tasks so everyone understands status at a glance. The end product is a dynamic tool you can customize for different groups and timeframes.
Designing the layout: columns, rows, and templates
A clean layout is the backbone of a reliable chore chart. Start with a header row and a logical column sequence: Task, Assigned To, Due Date, Priority, Status, Recurrence, and Notes. Rows below hold individual chores. Use consistent data types in each column (text for task names, dropdowns for status, dates for due dates).
- Suggested headers: Task | Assigned To | Due Date | Priority | Status | Recurrence | Notes | Points
- Data validation helps maintain consistency, e.g., a dropdown for Status (Not started, In progress, Done) and for Priority (Low, Medium, High).
- A simple template can reuse the same header row across sheets for different weeks or groups. This structure makes filtering, sorting, and updating painless for students, professionals, and families alike.
According to How To Sheets, starting with a standardized, easy-to-understand layout reduces cognitive load and accelerates adoption.
Essential formulas to automate chores
Formulas are the engine that keeps a chore chart accurate without manual tallying. A few core formulas make a big impact:
- Count completed tasks: =COUNTIF(StatusRange, "Done")
- Find overdue items: =IF(AND(DueDateRange<TODAY(), StatusRange<>"Done"), "Overdue", "On track")
- Total points earned: =SUMIF(StatusRange, "Done", PointsRange)
- Auto-fill status/date logic (using ARRAYFORMULA): =ARRAYFORMULA(IF(A2:A="",, IF(DueDateRange>TODAY(),"Upcoming","Due")))
These formulas adapt as you add more rows. Use named ranges to simplify references, and keep your data clean by avoiding merged cells in the data area. The formulas scale with your chores, not your effort.
Visual cues: using conditional formatting
Conditional formatting lets you see status at a glance. Create rules such as:
- Due date is past and Status is not Done → background color red
- Status = Done → background color green
- Priority = High and Status <> Done → border highlight
Tips for reliable formatting:
- Apply rules to the entire data range, not just individual cells
- Use a consistent color palette aligned with your brand or template
- Test rules with a few sample rows before applying to the whole sheet
This visual language helps families and teams quickly spot what needs attention.
Automating weekly rollups and dashboards
A compact dashboard summarizes activity and progress. You can pull weekly totals into a summary section with formulas like:
- Weekly completion rate: =COUNTA(TaskRange)/COUNT(TaskRange)
- Tasks by assignee: =QUERY(A2:H, "select B, count(A) where H = 'Done' group by B", 1)
Pivot tables are another clean option for a high-level view. Create a Pivot Table that shows tasks by person, status, and due date, then place the results on a dashboard sheet.
For teams sharing a sheet, protect the dashboard area and provide view access only where appropriate. The dashboard should stay read-only for most users to prevent accidental edits.
Templates and customization tips
A good template is a starting point, not a cage. Keep the core structure (headers, basic formulas, and a weekly template) and layer on customization:
- Duplicate the sheet weekly and rename for the new period
- Add a notes column for context and accountability
- Create a reusable drop-down list for Status and Priority
- Use a separate sheet for “Completed” lore to keep data tidy
How To Sheets analysis shows that teams benefit from templates that are easy to copy and adapt, reducing setup time and increasing consistency across weeks.
Common pitfalls and troubleshooting
Even simple templates can fail without careful setup. Common issues include data validation breaking when new options are added, formulas breaking after inserting rows, and inconsistent date formats causing sorting errors. To prevent these problems:
- Keep data validation lists centralized on a dedicated sheet and reference them with named ranges
- Avoid inserting rows within the data range unless you update formulas
- Use ISO date formats (YYYY-MM-DD) to standardize dates across devices and locales
If you notice misalignment, recheck ranges in formulas and ensure there are no stray spaces in text fields.
Real-world walkthrough: family chore chart example
Consider a family template with tasks like Dishwasher, Trash, Dishes, and Vacuum. Each task is assigned to a member, with a due date set for the week. Status updates to Done or In progress as chores are completed. A weekly dashboard shows how many chores were completed, who did them, and what’s overdue. A glance at the sheet reveals patterns: who consistently completes tasks on time and which days are busiest. This example demonstrates how a well-structured Google Sheets chore chart can reduce friction and increase household harmony.
Next steps: sharing, permissions, and maintenance
When you’re ready to deploy, share the chore chart with your group and set appropriate permissions. Use view-only access for most contributors to prevent accidental changes, and reserve editing rights for a few trusted members. Schedule a quick weekly check-in to review the dashboard and adjust tasks as needed. Finally, archive completed weeks in a separate sheet to keep the active chart lean and fast.
The How To Sheets team recommends establishing a short setup routine and a maintenance cadence so the chart remains useful over time.
Tools & Materials
- Google account with access to Google Sheets(Essential for creating and sharing the chore chart)
- Computer, tablet, or smartphone with internet access(Needed to edit and review the sheet)
- Shared drive or permissions in Google Workspace(Optional for collaboration at scale)
- Data validation lists (on a separate sheet)(Centralizes dropdown options)
- Template starter sheet or existing sheet to copy from(Speeds up setup)
Steps
Estimated time: 60-90 minutes
- 1
Create and name the sheet
Open Google Sheets and create a new blank spreadsheet. Name it clearly, such as 'Chore Chart - Week 1', so it’s easy to identify among other sheets.
Tip: Use a consistent naming convention (Week1, Week2, etc.) to simplify weekly rollups. - 2
Define headers and columns
Create a header row with columns like Task, Assigned To, Due Date, Priority, Status, Recurrence, Notes, and Points. Use data validation for dropdowns where appropriate.
Tip: Keep the data zone separate from the formatting zone to avoid accidental edits. - 3
Enter initial tasks
Fill in a starter list of chores for the week. Include a clear task description and responsible person.
Tip: If you’re rotating duties, include a Recurrence rule to remind you when tasks repeat. - 4
Add core formulas
Insert formulas for completion counts, overdue checks, and weekly totals as described in the guide.
Tip: Test formulas on a small sample before applying to the full range. - 5
Apply conditional formatting
Set rules to highlight overdue tasks in red and completed tasks in green. This creates instant visual feedback.
Tip: Apply rules to the entire data range to future-proof for new rows. - 6
Create a weekly dashboard
Build a compact dashboard using a Pivot Table or a small summary table to show totals by person, status, and due date.
Tip: Lock the dashboard area so contributors can’t alter the summary accidentally. - 7
Share and maintain
Invite participants with appropriate permissions and schedule a short weekly review to keep everyone aligned.
Tip: Archive old weeks and reuse the template for consistency.
FAQ
Can I share a chore chart with others in Google Sheets without giving editing rights?
Yes. You can share the sheet with view-only access for most users and grant edit access only to designated admins. This protects the data while enabling collaboration.
You can share with view-only access for most people and give edit access only to a few trusted teammates.
Which formulas are essential for a basic chore chart?
Key formulas include COUNTIF for completed tasks, SUMIF for points earned, and IF with TODAY for overdue checks. These automate tracking without manual tallying.
Important formulas are COUNTIF, SUMIF, and IF with TODAY to track completion and overdue items.
How can I update the chart for a new week without redoing everything?
Duplicate the sheet for the new week, adjust the dates, and reuse the header and formulas. This preserves consistency and saves time.
Duplicate the sheet for the next week and adjust dates; reuse the setup.
Is there a ready-made template I can start from?
Yes, you can start with a basic chore template and customize headers, validation lists, and formulas to fit your group’s needs.
There are ready templates you can customize to fit your group.
How do I ensure data remains consistent across multiple contributors?
Use data validation, protected ranges for critical areas, and a documented protocol for updates.
Enforce data validation and protect sensitive areas to keep data consistent.
Can I visualize progress with charts?
Yes. Build a small dashboard with charts or pivot tables to visualize completion by person or task category.
Absolutely—turn your totals into charts for quick insights.
Watch Video
The Essentials
- Define a clear chore chart layout and data rules
- Automate with formulas to reduce manual counting
- Use conditional formatting for quick status checks
- Create a weekly dashboard for at-a-glance progress
- Share with proper permissions and maintain consistency