Google Sheets Monthly Budget: A Practical Step-by-Step Guide
Master a practical Google Sheets monthly budget with templates and formulas. A step-by-step guide for students, professionals, and small business owners to track income and expenses.

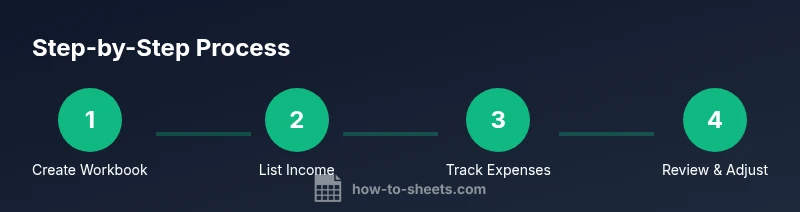
Create a reusable monthly budget in Google Sheets that tracks income, expenses, and savings in one tidy file. Start with a simple template, category buckets, and automatic totals. This guide from How To Sheets shows a practical, step-by-step approach you can customize for any month, with built-in checks and visualizations to stay on track.
Why a Google Sheets monthly budget matters
A well-organized budget helps you understand where money comes from and where it goes. Google Sheets is ideal because it’s free, collaborative, and highly customizable. According to How To Sheets, a live, shareable budget reduces miscommunication and keeps everyone aligned. A monthly budget also makes it easier to identify trends, set realistic goals, and plan ahead. By documenting income sources, fixed costs, and variable spending in one file, you gain a clear overview you can trust. This foundation makes future months faster to complete and more accurate, especially when you reuse a template and adjust figures as needed.
Template structure: what the workbook looks like
Your budget workbook should have a clean, repeatable structure. Suggested tabs include Income, Expenses, Summary, and Dashboard, plus Settings for currency, month, and templates links. Use a consistent header row, color-coded sections, and named ranges for formulas. The goal is to create a single source of truth that you can duplicate each month to maintain consistency across the year. How To Sheets recommends starting with a master layout and then duplicating it for future months to maintain consistency across the year.
Categorizing income and expenses for clarity
Define broad income categories (e.g., Salary, Freelance, Investments) and detailed expense categories (Housing, Utilities, Groceries, Transportation, Debt, Savings). Include a separate Savings category to track goals like emergency funds or short-term targets. Use one tab for absolute numbers and another for projected versus actuals to highlight variances. Having consistent categories makes reporting simpler and more accurate, which is particularly helpful for students budgeting within limited means and small businesses forecasting cash flow.
Core formulas and automation
Create a Summary sheet that pulls totals from Income and Expenses with simple SUM formulas, e.g. total income = SUM(Income!B2:B100) and total expenses = SUM(Expenses!B2:B100). Use SUMIF to categorize expenses by type and track monthly variances by comparing Actual versus Projected columns. Add simple conditional formatting to flag overspending. By using relative references and named ranges, you keep your workbook robust as months change. The How To Sheets team emphasizes keeping formulas transparent and easy to audit.
Visualization: charts and dashboards
Turn numbers into insight with charts. A bar chart by category reveals where most money goes, while a line chart shows monthly spending trends. A pie chart can illustrate income mix, and a sparkline in the dashboard offers a quick visual snapshot. Dashboards should summarize key metrics: net income, total expenses, and variance. Keeping visuals simple and accurate helps decision-making for students, professionals, and small business owners alike. Based on How To Sheets Analysis, 2026, visuals help you quickly spot patterns and adjust your plan.
Best practices and pitfalls to avoid
Common mistakes include manual data entry without validation, inconsistent categories, and forgetting to update the month in formulas. Use data validation for category cells, freeze header rows, and protect critical cells to prevent accidental edits. Regularly back up the sheet and consider sharing permissions that balance collaboration with privacy. How To Sheets notes that consistency in structure improves long-term budgeting accuracy.
Authority sources
- U.S. Bureau of Labor Statistics: https://www.bls.gov
- Consumer Financial Protection Bureau: https://www.consumerfinance.gov
- Federal Reserve: https://www.federalreserve.gov
Tools & Materials
- Google account with Google Sheets access(Needed to create and edit the budget file)
- Budget template draft (optional)(If you have a starting point, import as a sheet)
- Bank/Credit card CSV or receipts(To import expenses)
- Printer or PDF viewer(For printing or sharing offline)
Steps
Estimated time: 60-90 minutes
- 1
Create a new budget workbook
Open Google Sheets, name the file with the month and year (e.g., January 2026 Budget), and create a clean tab structure: Income, Expenses, Summary, Dashboard.
Tip: Use a consistent naming convention for easy searching later. - 2
List income sources
In the Income tab, list all revenue streams with expected amounts and a separate Actual column to track performance.
Tip: Include a 'Projected' and 'Actual' column for monthly variance. - 3
Define expense categories
Create broad and specific expense categories (Housing, Utilities, Groceries, Transportation, Debt, Savings). Keep categories consistent month-to-month.
Tip: Use a single source of truth for categories to simplify reporting. - 4
Enter baseline figures
Fill in projected monthly amounts for income and expenses. Leave optional fields empty if not applicable, then adjust as real data arrives.
Tip: Start with conservative estimates to avoid over-optimistic budgeting. - 5
Add formulas to total income and expenses
Use SUM to total income and expenses, and SUMIF to categorize expenses by type. Create a Summary cell for net income (Income − Expenses).
Tip: Label ranges clearly and use named ranges for readability. - 6
Create a monthly summary dashboard
Build a dashboard tab with key metrics: total income, total expenses, net income, and variance. Link charts to this dashboard.
Tip: Keep the dashboard concise—focus on actionable numbers. - 7
Set up charts for trends
Insert bar, line, or pie charts to visualize spending by category, monthly changes, and income mix. Customize colors for quick interpretation.
Tip: Use a legend and data labels to reduce confusion. - 8
Protect and share the sheet
Freeze header rows, lock critical cells, and set sharing permissions so teammates can view or edit where appropriate.
Tip: Regularly back up and review permissions to maintain data security.
FAQ
Can I use Google Sheets for a monthly budget?
Yes. Google Sheets is a practical tool for budgeting because it’s free, collaborative, and highly customizable. You can tailor income and expense categories and build formulas to automate totals.
Yes, Google Sheets is a practical budgeting tool because it's free and customizable.
How do I track savings within the budget?
Create a Savings category and a separate column for planned versus actual savings. Use a SUM formula to track total saved each month and monitor progress toward targets.
Create a Savings category and track planned versus actual savings.
Should I link bank data automatically?
You can import data via CSV or copy-paste, but automatic bank linking requires careful security practices. Review permissions and avoid exposing sensitive info in shared sheets.
You can import data with caution; be mindful of security.
How can I auto-fill months for future budgets?
Use date formulas to generate month labels and use copy-paste with relative references to replicate the structure for subsequent months.
Use date formulas to auto-fill new months.
Can I share the budget with others?
Yes. Use Google Sheets sharing settings to grant view or edit access. Establish guidelines to prevent overwriting or data loss.
Yes, share with defined permissions and guidelines.
How do I print my monthly budget?
Set up the print area and adjust scaling to fit on your preferred page size. Preview before printing to ensure readability.
Configure print settings so the budget prints clearly.
Watch Video
The Essentials
- Plan monthly before spending
- Keep categories consistent for clarity
- Automate totals to reduce errors
- Visualize data for quick insights