Monthly Expenses in Google Sheets: A Practical Guide
Learn to track monthly expenses in Google Sheets with a ready-to-use template, essential formulas, and visuals. This practical guide helps students, professionals, and small business owners budget better and visualize spending in one clean dashboard.

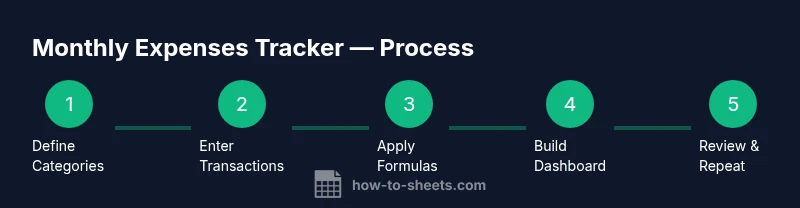
Learn to build a reliable monthly expenses tracker in Google Sheets. You’ll set up income and costs, organize entries by category, and use simple formulas to total and visualize spending for the month. The guide covers a ready-to-use template, data validation, and a clean dashboard to spot trends at a glance. You’ll also learn how to refresh monthly data and share the sheet with teammates.
Why monthly expenses matter and how Google Sheets helps
According to How To Sheets, a well-structured approach to tracking monthly expenses using Google Sheets empowers learners and professionals to see where money goes, identify waste, and plan more effectively. When you document every inflow and outflow in a central sheet, you reduce accidental omissions and make month-to-month comparisons easier. For the topic of monthly expenses google sheets, a lightweight, customizable template can translate scattered receipts into actionable insight without requiring complex software. The goal is clarity: every dollar has a category, a date, and a note, so you can spot trends quickly and adjust your spending habits accordingly.
By starting with a solid data structure, you’ll create a scalable system that grows with your budget—from student allowances to small business expenses. In practice, you’ll separate one-time purchases from recurring costs, group similar items into categories, and use simple formulas to derive totals and dashboards. The end result is a clear snapshot of where money goes, plus practical levers to reduce unnecessary spending over time.
Tip: If you’re new to Google Sheets, begin with a small sample month to learn the layout before you scale to multiple months or an annual view.
The core structure of a monthly expenses tracker
A robust tracker rests on a few non-negotiable components: a transactions table, a categories list, a date field, and a totals/dashboard sheet. For the goal of monthly budgeting, you’ll want a consistent row format such as Date, Category, Description, Amount, and Type (expense or income). Data validation on the Category column helps enforce consistent naming and totals accuracy over time. The template will typically include a Summary or Dashboard tab that aggregates data by month and category, providing at-a-glance insight into spending patterns. When designed thoughtfully, this structure supports quick month-over-month comparisons, month-to-date totals, and end-of-month reviews.
To stay practical, limit the number of categories to a manageable set (e.g., Housing, Transportation, Groceries, Utilities, Entertainment, Personal). If your life or business evolves, you can expand categories without breaking existing formulas. Your sheet should also accommodate future months, using a simple layout that can be duplicated for the next period with minimal adjustments.
Tip: Use a dedicated “Month” column or a named month range to simplify rolling month analyses and to keep future months ready for data entry.
Data validation and data entry tips
Data validation is the backbone of a reliable tracker. Start with a drop-down list for Category, a consistent date format, and a numeric constraint for Amount. A well-made Categories sheet can hold all category names; then you apply a data validation rule to the main sheet to pull from that list. This reduces typing errors and makes your totals consistent. For inflows (income) and outflows (expenses), consider a Type column with a simple 2-item list: “Income” and “Expense.”
Another crucial tip is to automate recurring expenses by pre-filling common line items (e.g., Rent, Internet) and setting them to repeat every month with a single copy. You can also set up a template row that you clone at the start of each month to preserve formatting and formulas while leaving room for new transactions.
Pro Tip: Always timestamp entries with a Date column. When you drag formulas, the date anchor ensures you’re summing the correct month automatically.
Formulas for totals, categories, and trends
Formulas are the engine that converts raw entries into useful numbers. A few core formulas unlock most budgeting needs:
- Monthly total: =SUMIFS(AmountRange, DateRange, ">="&StartDate, DateRange, "<="&EndDate, TypeRange, "Expense")
- Category total: =SUMIF(CategoryRange, "Groceries", AmountRange)
- Running balance: =SUM($Amount$2:$Amount2) and drag down for each row
- Category breakdown (dynamic): =SUMIF(CategoryRange, "=Groceries", AmountRange)
- Monthly average expense: =AVERAGEIF(MonthRange, MonthValue, AmountRange)
If you use a separate sheet for each month, you can consolidate totals with a simple 3D reference or a summary tab that pulls last month’s totals for trend analysis. Pivot tables are another option for deeper breakdowns by category, week, or merchant. Remember to adjust ranges as you add rows to keep formulas accurate.
Note: In Google Sheets, use named ranges to keep formulas readable and robust as you expand your dataset.
Visuals and dashboards for quick insights
A clean dashboard transforms data into decisions. Start with a month-over-month sparkline for overall spending: =SPARKLINE(TotalByMonthRange, {
charttype
line
linewidth
2
color
var(--accent)
})
Next, create a bar chart showing category totals for the current month. Visuals help you identify dominant spending areas at a glance. A donut chart can illuminate the share of income versus expenses in a given month. For ongoing monitoring, deploy a small, embedded KPI card showing the month’s total expenses, total income, and net income.
Finally, consider a trend line or bar graph of expenses by category over several months to reveal persistent spending patterns. A dashboard should be actionable, not decorative, so keep it lean and update it as you refine your categories.
Pro Tip: Use conditional formatting to highlight unusually high expenses or months that underperform against your planned budget.
A practical template walkthrough: setup example
This section walks through a practical setup that you can replicate. Start with two tabs: Transactions and Dashboard. In Transactions, create headers for Date, Category, Description, Amount, and Type. In Dashboard, create a few summary blocks: Monthly Total, Income, Expenses, and Net. Populate the first month with diverse transactions—rent, groceries, utilities, salary, freelance income—to verify that formulas calculate correctly. After you’ve confirmed the numbers look right, duplicate the sheet for the next month and adjust the date ranges.
If you’re sharing the sheet with teammates or classmates, lock critical cells (totals and formulas) to prevent accidental edits while keeping data-entry cells open for new entries. This ensures your base formulas stay intact while your data grows.
Tip: Keep a short description column in Transactions to remind yourself why a transaction is categorized a certain way, which helps in future audits.
Keeping data clean: common pitfalls and fixes
Maintaining data quality is essential for reliable insights. Common pitfalls include inconsistent date formats, misspelled categories, and missing amounts. Enforce date formatting with Data -> Data validation, and use a single source of truth for your categories. If you notice gaps, run a quick audit: filter for blank Amounts or unknown Categories and fill them before closing the month. Also, avoid deleting rows that formulas depend on; instead, hide them or move them to a dedicated archive sheet.
Another frequent issue is mixing up income and expenses in the same column. Use a separate Type column (Income/Expense) and adjust your sums accordingly. Finally, don’t forget to back up the sheet periodically or enable automatic saving in Google Drive so you always have a recovery point.
Warning: Do not rely on manual subtotaling for large datasets; leverage built-in functions and dashboards to minimize human error.
Automating monthly resets and sharing with others
To streamline monthly budgeting, set up a template that you copy at the start of each month. This minimizes repetitive setup and ensures consistency across months. Use the same column order, formatting, and named ranges across all monthly sheets. For sharing, adjust Google Sheets permissions to allow collaborators to edit data while keeping formulas protected. A well-crafted sharing setup makes budgeting collaborative and transparent across households or teams.
If you want to automate more, you can explore a simple Apps Script that copies the template into a new month and optionally emails a summary to stakeholders. Start small with a manual copy, then scale to automation as you gain confidence.
Pro Tip: Document your workflow inside the sheet by adding a hidden “readme” tab for future reference and onboarding.
Extending the template for larger budgets and future months
As your monthly budget grows, your sheet may need more advanced features. Consider adding a separate Savings or Debt category to track goals, or create a two-level category system (Main Category and Subcategory) to achieve more granular analytics. For longer timelines, build a rolling 12-month dashboard that highlights cumulative spending and variance from your plan. If you anticipate significant data volume, explore data ranges that automatically expand using dynamic named ranges or a script-driven approach.
Always contextualize your data with notes, receipts, or merchant IDs to improve traceability. With a scalable framework, the same template can handle personal budgets, student allowances, or a small business expense ledger without major rework.
Next steps and getting the most from this tracker
With the core structure in place, you’re ready to use and customize your monthly expenses tracker in Google Sheets. Keep your categories tight, your formulas clean, and your dashboard purpose-focused. Revisit the template monthly to capture learnings, adjust budgets, and celebrate savings milestones. Over time, you’ll build confidence in your financial picture and gain the discipline needed to meet financial goals.
Tools & Materials
- Google account with access to Google Sheets(Needed to create and save sheets in Drive)
- Internet-connected device(Laptop, tablet, or phone for editing and sharing)
- Ready-to-use template or blank sheet(If you have a template, you can customize; otherwise start from scratch)
- Receipts or notes for transactions(Optional for data entry speed and accuracy)
- Category list for validation(Create a master list to drive consistent categories)
Steps
Estimated time: 45-60 minutes
- 1
Create a new Google Sheet
Open Google Sheets and start with a blank workbook or a pre-made template. Name the file something like “Monthly Expenses Tracker – [Month]”. This creates a consistent starting point for monthly budgeting and ensures you can reuse the structure for future months.
Tip: Name the file clearly by month to avoid confusion later. - 2
Set up the Transactions sheet
Create columns for Date, Category, Description, Amount, and Type. Use a date format that you and collaborators will recognize and ensure Amount uses a numeric format. This table will feed all totals and visuals.
Tip: Lock the header row after formatting for consistent data entry. - 3
Create a Categories list and apply validation
In a separate sheet or a hidden area, list all expense categories. Use Data Validation on the Category column to pull from this list so users can only choose predefined categories. This reduces typos and improves reporting accuracy.
Tip: Keep the categories list concise and grow it only when necessary. - 4
Enter a sample of transactions
Populate several rows with representative transactions, including both income and expenses. This will help you test that totals and charts reflect the right numbers and give you a feel for real data entry.
Tip: Include a few recurring expenses to test patterns. - 5
Add summary formulas
On a Dashboard tab, insert formulas to calculate monthly totals, category totals, and net income. Example: Total Expenses = SUMIF(CategoryRange, "Expense", AmountRange). This is the core of your budgeting insights.
Tip: Use named ranges to simplify formulas and reduce errors. - 6
Create charts for quick insights
Add a bar chart for category totals and a line sparkline for month-to-month spending. Visuals make it easy to spot spikes and trends at a glance.
Tip: Keep charts focused on the current month for clarity. - 7
Test and duplicate for new months
Test the template by duplicating the sheet for a new month. Ensure formulas automatically adjust to the new date range and that dashboards reflect the new data. This saves time and preserves consistency.
Tip: Document a short onboarding note within the sheet.
FAQ
What is the simplest way to start tracking monthly expenses in Google Sheets?
Begin with a two-tab setup: a Transactions sheet for data entry and a Dashboard for totals and visuals. Define categories, enable validation, and populate a few sample transactions to test formulas and charts.
Start with two tabs: one for data entry and one for totals. Validate categories and try a few sample entries to see how everything updates.
How do I ensure my monthly totals roll correctly when the month changes?
Use date-based filters (StartDate and EndDate) or a Month column to segment data. Then anchor your monthly total formulas to the current month range so totals update automatically as the month changes.
Filter by the current month and base totals on that range so every new month updates automatically.
Can I import transactions from my bank into Google Sheets?
Yes, you can import transactions using CSV exports from your bank or use a Google Sheets add-on that connects to financial services. Keep in mind this requires careful mapping to your Categories and Type fields to maintain accuracy.
You can import bank data via CSV or add-ons, then map the fields to your sheet’s categories and type columns.
Which formulas are best for categorizing expenses by month?
SUMIF/SUMIFS are commonly used to total by category and month. For dynamic reporting, consider using a Pivot Table for multi-month category analytics.
Use SUMIF or SUMIFS for monthly totals and consider a Pivot Table for deeper category analysis.
How should I share the template with teammates without risking formulas getting changed?
Share with edit access for data entry only where needed, and protect essential cells containing formulas. Consider creating a separate read-only dashboard tab for oversight.
Share data-entry areas with teammates and lock the formulas to keep the tracker accurate.
Watch Video
The Essentials
- Track monthly expenses with a clear data structure
- Use validation to prevent misclassification
- Leverage simple formulas for totals and trends
- Create dashboards to visualize spending at a glance
- Duplicate monthly templates to save setup time