Income vs Expenses in Google Sheets: A Practical Comparison
Explore a comprehensive, data-driven comparison of income-focused vs expense-focused templates in Google Sheets. Learn structure, formulas, dashboards, and best practices to improve cash flow forecasting and budgeting for students, professionals, and small businesses.

TL;DR: For most budget-focused users, an income-vs-expenses template in Google Sheets offers clearer visibility, better forecasting, and easier month-end closes. Start with two streams (income and expenses), map entries to standard categories, and use reconciliation to keep totals aligned. The How To Sheets team endorses templated approaches for repeatability and accuracy.
Why income vs expenses in Google Sheets matters
According to How To Sheets, the way you structure income and expenses in Google Sheets drives clarity, forecasting accuracy, and decision-ready reporting. A well-organized "income vs expenses google sheets" setup helps you see cash flow at a glance, identify timing gaps, and reveal which revenue sources sustain your operations. For students, professionals, and small business owners, this approach turns raw data into actionable insights—without requiring expensive software. By deliberately separating inflows from outflows while preserving a shared timeline, you can compare performance across periods, spot seasonality, and prepare for lean months with confidence.
In practice, most people start with a basic ledger that records date, amount, category, and source. The moment you add a reconciliation column that links totals to a master cash-flow view, the ledger becomes a forecasting tool rather than a static ledger. This shift—from recording to predicting—delivers value for budgeting, tax prep, and strategic planning. The goal is to reduce guesswork and replace it with repeatable processes that scale as you grow.
Designing a robust data model for income vs expenses google sheets
A strong data model underpins reliable reporting in Google Sheets. Start with a clean taxonomy of income sources (salaries, freelance work, investments) and expense categories (fixed, variable, discretionary). Each transaction should carry a date, amount, category, and a subcategory for deeper analysis. Use named ranges or structured tables to simplify formulas and maintain consistency across sheets. To keep things scalable, separate the data input layer from the analytics layer: the input sheet gathers raw data, while a reporting sheet derives summaries.
Consistency matters more than cleverness here. Adopt a standard date format, ensure amounts are numeric, and predefine drop-down lists for categories to minimize entry errors. For longer horizons, consider a monthly or quarterly data model that aggregates by period and source. When you standardize how you store data, you unlock faster dashboards, more precise forecasting, and fewer reconciliation headaches. This consistency also makes it easier to share your workbook with teammates who may rely on your data for decisions.
Income-focused template vs expense-focused template
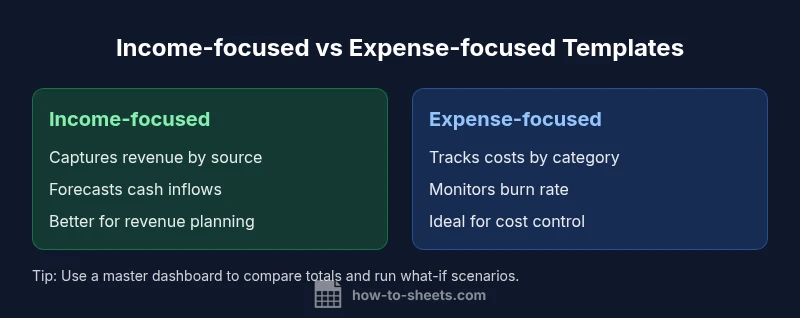
Choosing between income-focused and expense-focused templates hinges on your primary objective. An income-focused template emphasizes revenue streams, cash inflows, and forecasting future earnings. It’s ideal for founders, freelancers, and teams prioritizing revenue growth and liquidity planning. An expense-focused template centers on costs, burn rate, and expense control. It suits project managers, budgeting teams, and individuals aiming to tighten spend. In practice, many organizations start with a hybrid approach: a core monthly template that tracks both income and expenses, then a dedicated dashboard that highlights the net cash flow.
Key differentiators include where you place forecasts (income-heavy vs expense-heavy), how you categorize line items, and the kind of visuals you prioritize. If your goal is to project cash availability in upcoming weeks, an income-first design makes sense. If your priority is cost containment and variance analysis, an expense-first design often serves better. Regardless of the template type, you should maintain consistent category taxonomies and ensure ready access to both revenue and cost drivers for quick decision-making.
Data entry and categorization best practices
Data entry quality drives all downstream analysis. Use structured data entry forms or templates with clear column headers: Date, Source/Payee, Amount, Category, Subcategory, and Notes. Apply data validation to prevent invalid dates or non-numeric amounts, and implement dependent drop-downs so changes cascade consistently across the workbook. For income data, differentiate recurring vs. one-time inflows; for expenses, tag fixed vs. variable costs. A simple reconciliation row that cross-checks total income minus total expenses against a master balance helps catch errors early.
Automating routine entries saves time and reduces errors. For example, you can pull recurring income from a client list and set up rules to auto-assign categories based on payee. Similarly, recurring expenses like rent or subscriptions can be auto-filled with monthly increments. The more you automate without sacrificing accuracy, the faster you can close books and prepare forecasts. Remember to review categories periodically to reflect changing business lines or personal budgeting priorities.
Core formulas and automation you can use
Formulas are the engine of any income vs expenses model. Start with basic SUM to total columns and use SUMIF or SUMIFS to aggregate by category or source. The QUERY function enables powerful summaries and custom views. For cash-flow forecasting, create a dynamic forecast column that expands with future months and uses simple growth or seasonality assumptions. Conditional formatting helps you spot variances and anomalies at a glance.
Automation options range from simple to advanced. Use Google Sheets built-in features like Data Validation, Named Ranges, and conditional formatting for everyday reliability. For repeatable automation, consider Apps Script to import data from bank feeds or receipts, or to push summaries to a dashboard sheet. The goal is a model that remains accurate with minimal manual effort while offering the flexibility to adapt to changing data patterns.
As you add automation, document each rule and keep a changelog. A well-commented spreadsheet is easier to audit, share, and extend over time. Keeping formulas modular and avoiding hard-coded values makes your model more robust and easier to update.
Building dashboards and visualizations
Dashboards translate raw income vs expenses data into actionable insights. Start with a concise summary block showing total income, total expenses, and net cash flow for the current period, plus a trend line for the last 6–12 months. Use charts to visualize income by source and expenses by category, with color-coding that remains consistent across the workbook. Add filters so users can slice data by period, source, or category. The most effective dashboards are not overloaded with metrics; they highlight the critical levers driving cash flow.
Focus on clarity and accessibility. Use stacked bars to compare income vs expenses over time, line charts for revenue trends, and donut or pie charts for category shares. Provide context with small footnotes that explain spikes or dips. If you share the workbook with others, consider creating a read-only dashboard view to prevent inadvertent edits, while keeping the data layer editable by authorized users.
Beyond visuals, include a forecast panel that shows expected cash in and cash out for upcoming periods. This lets stakeholders anticipate shortages or surpluses and plan accordingly.
Forecasting cash flow with scenario analysis
Forecasting cash flow is about turning data into foresight. Build scenarios that adjust key drivers such as income growth rate, timing of inflows, and major expense fluctuations. A simple approach uses scenario columns: base, optimistic, and pessimistic. Link these scenarios to the forecast rows so you can compare outcomes side by side. Present the results in a compact table and a mini-graph to illustrate potential ranges in cash balance.
To keep scenarios practical, limit the number of variables you alter at once. Start with timing (early vs late receipts), then test revenue growth or major expense shifts. Document assumptions so readers understand why a scenario differs from the base case. Regularly update forecasts as real data arrives; this ensures your projections stay relevant and useful for decision-making.
Finally, tie forecasting to business planning: use scenario results to inform hiring, investments, and pricing strategies. A disciplined approach to scenario analysis reduces the risk of surprises and supports proactive planning.
Real-world workflows for students, professionals, and small businesses
Different users have distinct needs when managing income vs expenses in Google Sheets. Students often track personal budgets and part-time earnings, while professionals may manage client income and project costs. Small businesses typically monitor multiple revenue streams and a spectrum of expenses. A pragmatic workflow starts with a core template that captures all inflows and outflows, then adds dashboards tailored to your role. For students, focus on essential categories and a straightforward forecast. For professionals, emphasize project-based income and cost centers. For small businesses, build a multi-source revenue model with department or client-level cost tracking.
Across all groups, consistency in data entry, clear category definitions, and timely reconciliations are vital. Establish a routine—entry immediately after transactions, weekly checks, and monthly closes. When the template scales, maintain standardized naming, back up data regularly, and implement security measures to protect sensitive financial information.
Getting started: a starter template you can copy
If you want a structured starting point, copy a starter template that includes separate income and expense areas, a unified date column, and dashboards. Begin by adding a handful of sample entries for both income and expenses to validate your formulas and visuals. Next, customize your categories to match your context—whether you’re budgeting a student loan, freelance income, or business operations. Finally, test the forecasting features by adjusting a couple of inputs and watching how the dashboard responds. A solid starter kit reduces setup friction and accelerates your path to meaningful insights.
Comparison
| Feature | Income-focused template | Expense-focused template |
|---|---|---|
| Data entry emphasis | Income streams and timing | Expense categories and recurring costs |
| Automation & formulas | SUMIFs and forecast columns for revenue | SUMIFs and auto-expense summaries |
| Forecasting capabilities | Cash-flow projections by income source | Burn rate and cost projections |
| Visualization options | Income trend charts; revenue by source | Expense by category; cost trend visuals |
| Best for | Revenue-led planning (growth-oriented) | Budget control and cost management |
| Setup complexity | Moderate complexity; more formula setup | Low-to-moderate complexity with templates |
The Good
- Improved cash-flow visibility and forecasting with structured data
- Easier month-end closes and reporting through templates
- Scalability for growing income streams and expense categories
- Better collaboration when using standardized templates
The Bad
- Requires consistent data entry discipline
- May be intimidating for new users without templates
- Ongoing maintenance to reflect changing income or expense structures
- Templates may need customization for complex business models
Income-focused templates are typically best for forecasting and revenue planning; expense-focused templates excel at cost control and budgeting.
Choose income-focused if you prioritize cash-flow forecasting. Opt for expense-focused if controlling costs and tracking spend matters more. A hybrid approach often yields the most robust results, especially for growing teams.
FAQ
What is the best starting structure for income vs expenses in Google Sheets?
Begin with two streams: income and expenses, each with date, amount, and category. Add a master balance and a reconciliation row to link totals to a cash-flow view. This provides clarity and supports forecasting from day one.
Start with separate income and expense sections and a reconciliation step to tie totals to your cash flow.
How can I automate data entry from receipts or bank statements into Sheets?
Use built-in imports or Google Apps Script to pull transaction data. Set up templates that parse date, amount, and category, then categorize entries automatically into income or expense rows.
Automate data entry with imports or scripts to save time and reduce errors.
Should I keep income and expenses on one sheet or separate sheets?
A single sheet provides a holistic view but can get cluttered. Separate sheets with a consolidated dashboard often balances detail with readability and control.
One sheet is simple; separate sheets plus a dashboard usually works best.
What formulas are most useful for summarizing income vs expenses?
SUM, SUMIF/SUMIFS, and QUERY help aggregate by category, source, or date. FILTER can create focused views; use array formulas for responsive dashboards.
Key formulas are SUM, SUMIF, QUERY, and FILTER.
How do I visualize income vs expenses to support decisions?
Use line charts for revenue trends and stacked bars for spend by category. Keep color schemes consistent and add a compact dashboard with key metrics for quick decisions.
Use charts to compare income and expenses side by side.
The Essentials
- Define clear income and expense categories to improve traceability
- Use templates to standardize data entry and reduce errors
- Leverage formulas (SUMIF, QUERY) for dynamic reporting
- Build dashboards for quick, decision-ready insights
- Regularly refresh forecasts to reflect actuals and changing assumptions