Charts and Data Visualization
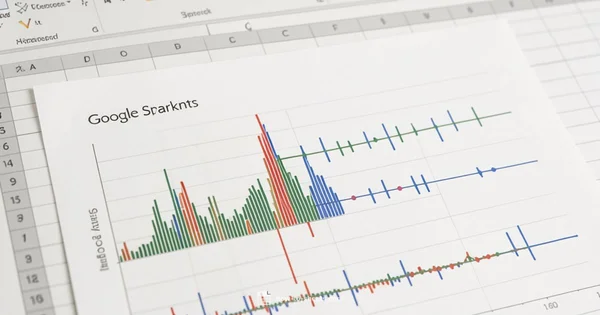
Types of Sparklines in Google Sheets
5 min
64 articles


Learn how to track google sheet visit history, log access times, identify collaborators, and audit activity with templates and formulas. This educational How To Sheets guide covers setup, logging, analysis, and best practices for secure, actionable records.


Learn how to calculate and interpret the google sheets z score using built-in formulas like AVERAGE and STDEV, with practical data prep, step-by-step instructions, handling edge cases, and real-world examples.
A kid-friendly, step-by-step Google Sheets tutorial that teaches data entry, formatting, and basic formulas through fun, safe activities suitable for young learners.
Discover practical Google Sheets conditional formatting tips to highlight data, flag anomalies, and improve readability with color scales, icon sets, and custom formulas.