Budgeting Google Sheets: A Practical Step-by-Step Guide
Practical, step-by-step budgeting in Google Sheets with templates, formulas, and dashboards. Designed for students, professionals, and small business owners.

By budgeting in Google Sheets, you can track income, expenses, and saving goals with a live, shareable document. Start with a simple income-expense layout, add categories, set formulas for totals and variances, and build a lightweight dashboard. This 6-step approach from How To Sheets helps students, professionals, and small business owners manage money effectively.
Why Budgeting with Google Sheets Matters
Budgeting with Google Sheets gives teams and individuals a flexible, collaborative space to monitor cash flow in real time. According to How To Sheets, practical budgets built in Sheets adapt as income changes and expenses fluctuate, reducing late-month surprises. The platform's cloud-based nature means you can access your numbers from any device and share a single source of truth with teammates or clients. For students, it provides a low-cost, scalable toolkit; for professionals, it supports recurring reports; for small business owners, it pairs cash flow planning with project budgeting. The benefits extend beyond numbers:
- Real-time collaboration and version history
- Easy integration with bank feeds, receipts, and invoices
- Customizable templates that scale with your needs
- Simple formulas that reveal totals, variances, and trends
While spreadsheets have a reputation for being error-prone, Google Sheets' validation and protection features help you lock formulas and standardize inputs. In the rest of this guide, you'll learn a practical, step-by-step approach to budgeting in Google Sheets that works for any situation.
Core Budgeting Concepts for Google Sheets
A budget is a plan that aligns income, expenses, and savings over a period. In Google Sheets, you typically model three core ideas: income (what comes in), expenses (what goes out), and net savings (the difference). Use “budgeted” versus “actual” columns to compare expectations to reality. Variance analysis highlights overspending or under-earning, guiding course corrections.
To keep your sheet resilient, separate your inputs from calculations. Put all category names in a clean list, then reference that list in formulas rather than hard-coding each category. This makes updates painless and reduces errors when you add new months or categories. Finally, plan for future months by establishing a reusable framework you can copy and adapt, rather than rebuilding from scratch each time.
Practical tip: choose a fixed set of categories (e.g., Housing, Transportation, Food, Utilities, Debt, Entertainment) and keep subcategories consistent across months. This consistency is what makes year-over-year comparisons meaningful and dashboards informative.
Designing Your Budget Framework
A solid budget framework in Google Sheets typically includes three sections: Inputs (assumptions and targets), Calculations (totals and variances), and a Dashboard (visual insights). Start with a clean layout: a tab for Inputs with a categorized list of income sources and expense types; a Calculations tab that uses formulas to total by category and month; and a Dashboard tab that presents charts and high-level metrics. Use named ranges for categories, months, and key totals so formulas stay readable and easy to audit.
Data validation helps prevent bad inputs, such as negative values or misspelled categories. Lock critical formulas with sheet protection to keep your model intact when multiple people edit the same document. As you scale, consider a multi-month structure (12 months) and a year-to-date summary. Finally, document assumptions in a dedicated area so anyone can understand the budget logic at a glance. This structure keeps your budget maintainable and extensible.
Build a Monthly Budget: Core Formulas
The backbone of a monthly budget is simple arithmetic and logical checks. On the Calculations tab, use:
- SUM to total all income cells for the month
- SUMIF or SUMIFS to add amounts by category
- AVERAGE or MEDIAN for typical expenses
- IF statements to flag warnings (e.g., IF actual > budget, THEN highlight)
A typical setup uses:
- Income totals: =SUM(Incomes!B2:B12)
- Category totals: =SUMIF(Categories!A:A, "Housing", Incomes!B:B)
- Monthly expenses: =SUMIF(Expenses!A:A, A2, Expenses!B:B)
- Variance: =Budgeted - Actual
To reduce maintenance, copy formulas with relative references and convert ranges to named ranges. Use ARRAYFORMULA to auto-fill rows, and consider using QUERY to summarize data for the Dashboard. Keep a separate column for notes so you remember why a number changed.
Pro tip: lock the header row and freeze panes so you can scroll without losing context.
Visualization: Dashboards and Reports
Translate numbers into visuals that tell the budget story. Create charts on the Dashboard tab:
- Bar chart: spend by category
- Pie or donut: proportion of expenses
- Line chart: cash balance over time
Link charts to the Calculations tab so they update automatically as you input new data. Use conditional formatting to draw attention to overspending or declining balances. If your sheet grows, you can segment dashboards by quarter or by project, and use slicers or filter views to explore different scenarios. A clean dashboard helps you spot trends at a glance and share insights with stakeholders.
Templates and Automation Tips
Start with a proven budgeting template and adapt it to your needs. How To Sheets offers practical Google Sheets templates you can customize, saving time and reducing errors. For ongoing budgets, consider automation:
- Import bank transactions via IMPORTDATA or an App Script connector
- Use a single source of truth for categories so Excel users can mirror your taxonomy
- Schedule weekly data refreshes or monthly summaries with time-driven triggers
If you prefer no-code, use the built-in Explore and recommended charts to build quick visuals. Document your workflow so teammates can reproduce results, and consider sharing a read-only version to protect calculations.
Common Pitfalls and How to Fix Them
Budgeting in Google Sheets can go awry if you neglect structure or validation. Common problems include:
- Inconsistent categories across months, which breaks totals. Fix by locking category lists with named ranges and data validation.
- Broken formulas after edits. Fix by using absolute references and protecting core cells.
- Manual data entry errors. Fix by importing data or using forms to feed inputs.
- Missing months or misaligned dates. Fix by standardizing date formats and using a consistent 12-month layout.
By testing the model with dummy data and keeping a changelog, you’ll catch issues before they propagate. The payoff is a transparent, auditable budget that remains useful as circumstances change.
According to How To Sheets, a disciplined setup minimizes mistakes and boosts confidence in your numbers.
Authority Sources
- https://www.consumerfinance.gov/ (U.S. government consumer budgeting resources)
- https://www.investopedia.com/ (Major financial education publication)
- https://www.census.gov/ (Official data and statistics to inform budgeting assumptions)
Tools & Materials
- Google account(You need a Google account to use Google Sheets)
- Google Sheets access(Open sheets.google.com or use the mobile app)
- Budget template file (Google Sheets)(Start with a simple budget template or create a new sheet)
- Sample income/expense data(Optional but helpful to test the model)
- Internet connection(Needed for collaboration and syncing)
- Optional: mobile device(View budget on the go)
Steps
Estimated time: 25-40 minutes
- 1
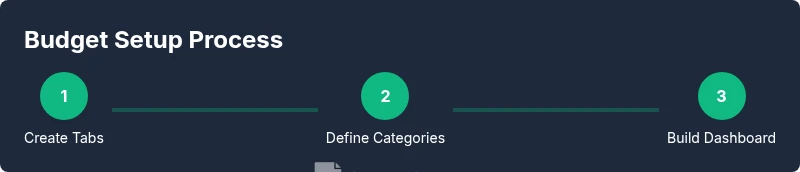
Create the budget file and structure tabs
Open a new Google Sheet and create three main tabs: Inputs, Calculations, and Dashboard. Freeze the header row and name tabs clearly to avoid confusion as you grow the model.
Tip: Name each tab precisely and use a consistent header layout. - 2
Define income and expense categories
Create clean, stable category lists (e.g., Housing, Transportation, Food) on a separate sheet or named range. Reference these lists in your formulas to make updates painless.
Tip: Keep categories consistent month to month. - 3
Enter baseline income and expense estimates
Input your expected monthly income sources and expense targets in the Inputs tab. Use separate columns for Budgeted and Actual values to enable variance analysis.
Tip: Be realistic and leave room for occasional surprises. - 4
Build core calculations
In Calculations, create totals for income and expenses using SUM, then compute variances with Budgeted minus Actual. Use SUMIF/SUMIFS to total by category.
Tip: Prefer absolute references for the core totals. - 5
Create a multi-month budget and dashboard
Expand the model to cover 12 months and add a Dashboard tab with charts tied to your calculations. Use conditional formatting to highlight overspending.
Tip: Use a dynamic date axis and named ranges for months. - 6
Set up basic automation
If possible, automate transaction imports with IMPORTDATA or Apps Script and protect formulas to minimize accidental edits.
Tip: Document every automation step for teammates.
FAQ
What is the best budget structure in Google Sheets?
A simple three-tab model (Inputs, Calculations, Dashboard) works well. It keeps data organized and scalable for future months.
A simple three-tab model works well and keeps your budget scalable.
Which formulas are essential for budgeting in Sheets?
SUM for totals, SUMIF/SUMIFS for category totals, and QUERY or ARRAYFORMULA for dynamic summaries. These form the backbone of most budgets.
SUM, SUMIF, and QUERY or ARRAYFORMULA handle most budget needs.
How can I ensure data accuracy in a budget sheet?
Use data validation, protect critical ranges, and rely on version history to track changes. This reduces errors during collaboration.
Use data validation and protect important ranges to reduce errors.
Can I automate importing transactions?
Yes. Use IMPORTDATA or Apps Script to pull CSV transactions and map them to your categories, reducing manual entry.
You can automate imports with IMPORTDATA or Apps Script.
How do I share a budget without exposing formulas?
Share read-only links or protect the sheet and use named ranges for inputs. This keeps calculations intact while enabling collaboration.
Protect the sheet and share read-only access.
Watch Video
The Essentials
- Define income and expenses clearly
- Use formulas to auto-calculate totals
- Create a monthly dashboard for insights
- Automate data entry to save time