Google Sheets Car Comparison Template: Side-by-Side Evaluation
A practical guide to using a google sheets car comparison template for side-by-side car analyses. Learn to structure models, inputs, weights, and visuals to choose the best value.

A google sheets car comparison template lets you compare multiple car models side-by-side using shared criteria, weights, and formulas. It helps quantify cost of ownership, fuel efficiency, and reliability to pick the best value. This guide shows setup steps and a ready-to-fill comparison table for fast, data-driven decisions.
What is a google sheets car comparison template?
A google sheets car comparison template is a structured workbook you can reuse to evaluate multiple car options against a common set of criteria. By standardizing inputs (price ranges, fuel economy, maintenance, insurance) and attaching formulas, you get apples-to-apples comparisons rather than scattered notes. According to How To Sheets, templates like this reduce decision fatigue by translating qualitative impressions into quantitative scores. The How To Sheets team found that users who adopt a template consistently report clearer tradeoffs and faster selections when shopping for vehicles. In practice, you create a list of candidate models, enter estimates or observed values, and let the sheet compute total cost of ownership, lifetime value, and overall score. The goal is not to pick a single number but to reveal how different factors interact across options. This approach applies beyond cars; it scales to any major purchase where price, performance, and reliability matter. The template acts as a living document that you can customize, share with teammates, and revise as new data becomes available. If you want reproducible, transparent decision-making, start with a google sheets car comparison template today.
Why a structured template matters for students, professionals, and small teams
A well-crafted template removes guesswork and provides a clear framework for decision-making. Students can compare affordable options for projects or internships, professionals can benchmark company vehicles, and small businesses can evaluate fleet purchases. How To Sheets analysis shows that templates reduce time-to-decision, minimize missed factors, and support collaborative updates. By housing all inputs in one place, teams avoid duplicating effort and ensure everyone is using the same assumptions. The template also serves as an auditable record: as data changes, the sheet recalculates results, preserving a history of how conclusions shifted over time. In fast-moving markets, having a centralized, shareable document accelerates consensus. This article focuses on a practical setup you can implement today to start gathering objective signals and meaningful tradeoffs.
Core criteria for evaluating car options
When you’re comparing cars, you should judge each option against a consistent set of criteria. Key factors include total cost of ownership (TCO), upfront price or MSRP, depreciation, fuel economy, insurance costs, maintenance and repair expenses, warranty coverage, reliability, resale value, cargo and passenger space, and comfort. Weight these factors according to your needs (for example, a long-term commuter might value fuel efficiency and reliability more than initial price). Consider also factors like driving experience, technology features, and after-sales service when appropriate. The goal is to create a scoring model where each option receives a composite score that reflects your priorities. This section will help you define the right criteria for a google sheets car comparison template. The structure remains flexible enough to adapt to changes in market data or personal preferences.
How to structure the template in Google Sheets
Start with a clean workbook and a consistent header row. Create a tab for the data input (models, prices, costs, and scores) and another for calculations (formulas, weights, and final scores). Use named ranges for key inputs to simplify formulas and reduce errors. Common formulas include SUM, AVERAGE, and VLOOKUP for pulling model-specific data, as well as basic arithmetic for total costs. A weighted scoring column typically multiplies each criterion score by its assigned weight and sums the results to a final score. For example, you might compute a total ownership cost as MSRP plus annual costs minus resale value, and a weighted score as SUM(Weight1Score1, Weight2Score2, ...). Consistency in units (dollars, mpg, miles, years) is essential for valid comparisons. Protect or lock critical cells to prevent accidental edits in a shared spreadsheet.
Template layout: sheet tabs and named ranges
Organize your workbook into clear sections: 1) Data Input (Model, MSRP, fuel economy, insurance, maintenance, depreciation, resale value, etc.), 2) Calculations (Total Cost of Ownership, Net Value, Weighted Score), 3) Outputs (rankings, visual summaries). Use descriptive column headers and keep units visible. Create named ranges like rngModels, rngCosts, and rngWeights to simplify formulas and enable quick template customization. Add data validation to drop-down menus (e.g., model names) to minimize typos, and use conditional formatting to highlight best options. This layout keeps the template scalable—from a simple two-model comparison to a portfolio of several vehicles. A well-structured sheet reduces cognitive load and supports fast, repeatable analyses.
Example scenario: three car models with hypothetical ranges
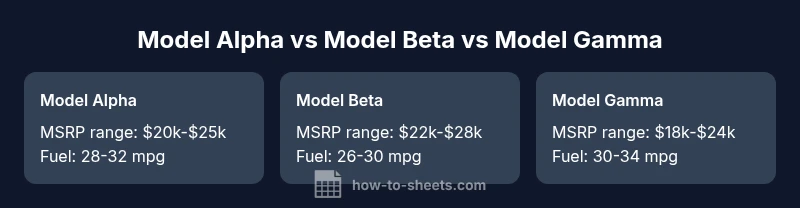
Imagine you’re evaluating three models: Alpha, Beta, and Gamma. MSRP ranges could be $20k-$25k for Alpha, $22k-$28k for Beta, and $18k-$24k for Gamma. Estimated annual costs (insurance, maintenance, fuel) might be $2k-$3k, $1.8k-$2.8k, and $2.2k-$3.0k respectively. Depreciation over five years may vary, with typical ranges reflecting brand reliability and demand. For a practical template, you assign weights to each criterion based on your priorities (e.g., 40% weight to total cost of ownership, 30% to reliability, 20% to fuel economy, 10% to features). The template calculates a weighted score and a final recommendation. This scenario illustrates how a google sheets car comparison template translates qualitative impressions into quantifiable decisions. It also demonstrates the importance of using ranges rather than fixed numbers to reflect market uncertainty.
Calculating total cost of ownership and scoring
To capture the full picture, separate inputs from calculations. A robust template separates MSRP, taxes, registration, insurance, maintenance, fuel, and depreciation. You can express total ownership cost over five years as a sum of initial MSRP, five-year taxes and fees, five-year insurance, five-year maintenance, and depreciation. Then compute resale-adjusted value. For scoring, assign a weight to each criterion and compute a weighted sum. For instance, finalScore = WeightCost * (1 / (1 + TotalCostOfOwnership)) + WeightFuel * FuelEconomyScore + WeightReliability * ReliabilityScore. Practically, you’ll implement these formulas with named ranges, ensure consistent units, and test with edge data to verify robustness. This approach ensures that the template remains accurate as data changes over time.
Visuals and dashboards: turning data into insight
Beyond raw numbers, a car comparison template benefits from visual insight. Create charts that show TCO by model, fuel economy comparisons, and depreciation trajectories over time. Dashboards can display key indicators like lowest TCO, best reliability score, and best overall value. Conditional formatting helps you spot top performers at a glance, while sparklines summarise trends within each model’s data. If you want perpetual value, link the template to external data sources with data validation and refresh controls. The resulting visuals support quick, confident decisions in meetings or personal planning.
Common mistakes and optimization tips
Common mistakes include mixing currencies or units, failing to update data, neglecting resale value, and using a single fixed price when ranges are more realistic. To avoid these pitfalls, use ranges for prices and costs, lock key formulas, and regularly audit inputs. Establish a baseline dataset and perform periodic re-evaluations as new information comes in. Keep the template simple enough for new users, yet flexible enough for power users who want advanced weighting and scenario analysis. Finally, document assumptions and data sources so others can understand and trust the results.
Feature Comparison
| Feature | Model Alpha | Model Beta | Model Gamma |
|---|---|---|---|
| MSRP range | $20k-$25k | $22k-$28k | $18k-$24k |
| Estimated 5-year fuel economy | 28-32 mpg | 26-30 mpg | 30-34 mpg |
| 5-year maintenance estimate | $1.8k-$2.8k | $2k-$3k | $2k-$3k |
| 5-year insurance estimate | $1.2k-$1.8k | $1.0k-$1.6k | $1.1k-$1.7k |
| Depreciation (5-year) | $6k-$9k | $7k-$10k | $5k-$8k |
| Resale value after 5 years | $9k-$13k | $9k-$14k | $8k-$12k |
| Best for | Value-focused buyers | Tech-loaded but pricier | Affordability-first buyers |
The Good
- Clear apples-to-apples comparison across models
- Flexible, repeatable framework for future buys
- Supports data-driven decision making for teams
- Easily shareable and auditable in spreadsheets
- Scales with more criteria and models
The Bad
- Initial setup requires careful data collection
- Weights reflect opinions and may bias results if not calibrated
- Relying on ranges can mask precise pricing dynamics
- Maintenance costs depend on data freshness
A well-structured Google Sheets car comparison template provides the most transparent, repeatable decision framework.
For anyone weighing multiple car options, a standardized template clarifies tradeoffs, enables scenario analysis, and facilitates collaboration. It is the best approach when you need defensible, data-driven outcomes and a repeatable decision process.
FAQ
What is a google sheets car comparison template?
A google sheets car comparison template is a reusable workbook that consolidates candidate car models, input data, and calculations to compare options on a common scoring framework. It translates subjective impressions into objective scores and supports transparent decision-making.
A google sheets car comparison template is a reusable workbook that helps you compare car options using a common scoring framework.
Can I customize formulas and weights to fit my needs?
Yes. The template is designed to accept different weighting schemes and formulas for total cost of ownership, scoring, and scenarios. You can adjust weights, add criteria, or change calculation methods to reflect your priorities.
Yes. You can customize the weighting and formulas to fit your exact needs.
Is this suitable for fleet planning or only personal use?
The template can scale from a single-user, personal decision to fleet planning. By adding multiple models, shared weights, and centralized data sources, it supports collaborative decision-making for group purchases.
It can scale from personal use to fleet planning with collaborative features.
How do I share and collaborate on the template?
Share via Google Sheets with edit or view permissions. Use comments for discussions, and maintain a changelog within the sheet to track updates and decisions.
Share the sheet with permissions and use comments to discuss changes.
What are common mistakes to avoid when building the template?
Avoid mixing currencies or units, failing to update inputs, and relying on a single score without validating with sensitivity analysis. Always back up data and test edge cases.
Avoid unit mismatches and stale data; test edge cases too.
How often should I refresh data in the template?
Refresh data whenever market prices, fuel costs, or warranty terms change. Establish a routine (e.g., quarterly) to keep comparisons relevant.
Refresh data whenever inputs change; a quarterly review is a good baseline.
The Essentials
- Define your criteria and weights up front
- Use ranges to reflect market uncertainty
- Keep inputs clean and formulas robust
- Leverage visuals to communicate results
- Document assumptions for auditability