Google Sheets College Comparison Template: Side-by-Side Guide
A practical, data-driven guide to using a Google Sheets college comparison template. Learn setup, customization, and analysis steps to compare programs, tuition, deadlines, and fit for students and professionals.

For most students, professionals, and small teams, the prebuilt Google Sheets college comparison template delivers fast, reliable insights. If you need a quick, shareable way to evaluate programs by tuition, deadlines, and fit, start with the template and adjust weights as needed. According to How To Sheets, template-driven comparisons reduce setup time and improve consensus among decision makers.
Why a Google Sheets college comparison template matters
Choosing a college is a data-driven decision for many students and families. A well-designed Google Sheets college comparison template helps you organize critical criteria in one place, compare apples to apples, and share findings with mentors or peers. By consolidating tuition, deadlines, program length, location, and campus attributes in a single sheet, you can visualize trade-offs without flipping between dozens of PDFs or notes. According to How To Sheets, template-driven workflows reduce setup time and improve consensus among decision makers, especially when working across teams. A college decision is rarely about the cheapest option; it’s about fit, long-term value, and logistics. The template supports both qualitative and quantitative inputs, so you can rank programs by personal priorities like class size, internship opportunities, and geographic preferences, then attach links to official pages or scholarship details. With the right design, you can simulate scenarios—what if tuition increases by x% or scholarship coverage changes? The outcome is a clear, shareable decision-tracker rather than scattered notes.
How to choose the right template for your needs
Your choice between a prebuilt Google Sheets college comparison template and a do-it-yourself (DIY) setup should hinge on your time, customization needs, and collaboration style. A prebuilt template accelerates onboarding, provides a tested layout, and minimizes initial design work. A DIY approach offers full control over criteria, scoring, and workflow integration with other sheets or apps. How To Sheets notes that most teams benefit from starting with a solid template and then layering additional fields as the project scales. If you’re evaluating multiple programs with many criteria, a template with weighted scoring and conditional formatting can help you visualize trade-offs quickly. For students balancing academics and work, speed matters—choose a model that reduces friction while maintaining clarity for group discussions and advisor reviews.
What makes a strong column layout
A robust column layout is the backbone of any college comparison template. Core columns typically include: College name, Location, Program, Degree type, Tuition estimate, Scholarships, Start term, Deadlines, Admission requirements, Program length, Campus life indicators, and Notes. For readability, separate numeric data from qualitative insights, and use consistent units across rows. Add a dedicated column for “Weight” or “Priority” to reflect user preferences, and consider a “Scoring” column that computes a composite score based on your weights. Using clear headers, frozen top rows, and alternating row colors improves scan-ability in dense sheets, especially when collaborating with mentors.
Field-by-field guide: what to include
Aim to cover both objective metrics and subjective impressions. Suggested fields: College, City/State, Program name, Degree type (BA/BS/MA), Annual tuition range, Estimated costs (housing, meals, books), Scholarships/aid, Application deadlines, Minimum GPA, Standardized test requirements, Start term, Program duration, Campus size, Internship opportunities, National ranking, Campus safety, Housing options, Notable advantages, and Important notes. Include a “Source” column with links to official pages. Consider adding a “Date last updated” column to keep your data current and a separate “Notes” field for anything unique to the program. To keep data consistent, use drop-down lists for fixed categories and data validation rules to prevent invalid entries.
Scoring and decision metrics you can trust
The real value of a template comes from how you score and compare programs. Use a weighted scoring model where each criterion has a defined importance score (for example, 0–10). Normalize values so that different scales align (e.g., tuition in thousands, distance in miles, campus life on a 1–5 scale). Create color-coded rules to flag favorable outcomes (green), neutral (yellow), or unfavorable (red). Build a summary column that aggregates weighted scores into a single overall score per school, plus an “overall fit” narrative based on your top criteria. If you’re unsure about weights, run a quick sensitivity test by adjusting one weight at a time and observing how the top picks shift. Remember, numbers tell part of the story—qualitative notes capture context like campus culture and regional preferences.
Prebuilt vs DIY: pros and cons
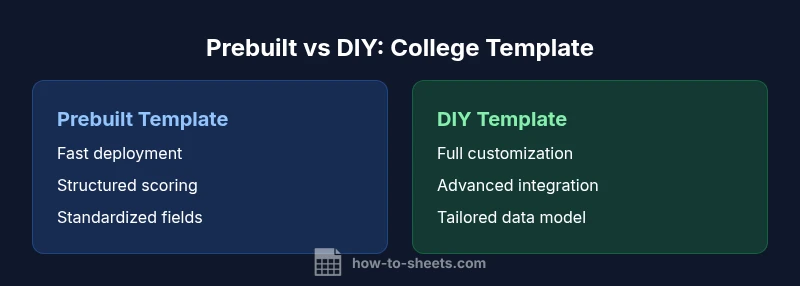
Prebuilt templates are designed for rapid deployment and include tested layouts, formulas, and validation. They’re best when you need speed and consistency across teams. DIY templates offer maximum customization, allowing you to tailor fields, scoring, and references to your exact decision criteria. They’re ideal when you have unique requirements or want to integrate the sheet with other processes. How To Sheets emphasizes starting with a solid base: use a prebuilt template as a foundation, then adapt sections or formulas to your situation. For teams with tight deadlines, a mixed approach can work well: adopt the template’s core sections and progressively add niche fields as you gather more data.
Step-by-step setup: from blank to filled
- Define your decision criteria and assign weights. 2) Create columns for each criterion and standardize data formats. 3) Add a tuition/cost range and a scholarship column with simple yes/no indicators. 4) Build a scoring formula that multiplies criterion weights by normalized scores. 5) Freeze header rows and format cells with consistent fonts and colors. 6) Populate sample rows for a few colleges and test the scoring. 7) Save a copy as a template and share with teammates for feedback.
Data validation and error-prevention techniques
Use drop-downs for fixed categories (Program type, Location, Start term) to reduce typos. Apply data validation on numeric fields (tuition, weight, scores) to ensure values stay within expected ranges. Lock key formula cells to prevent accidental edits, and add a simple audit column to track changes. Use conditional formatting to highlight missing data, outliers, or mismatched units. Finally, implement a review checklist to verify data during updates.
Collaboration and sharing best practices
Share the Google Sheet with edit access only to trusted teammates. Use protected ranges for critical formulas and a separate view for stakeholders who don’t need to edit. Attach a short guide tab with definitions, data sources, and scoring instructions. Schedule regular data refresh cycles, and create a lightweight change log to capture updates. When presenting to a group, export a PDF snapshot and a clean, print-friendly version of the comparison.
Real-world scenarios: college comparison examples
Scenario A compares in-state public universities against private institutions, focusing on total cost of attendance, scholarship likelihood, and campus location. Scenario B weighs distance from home against internship opportunities in a metro area. Scenario C emphasizes program-specific factors like clinical hours, lab facilities, or graduate outcomes. Each scenario demonstrates how to tailor weights and notes to fit the user’s priorities, providing a transparent, auditable decision process.
Authority sources
- Authority sources: U.S. Department of Education (ed.gov) and NCES (nces.ed.gov) provide context on tuition trends, program duration, and outcomes. - These sources guide your data interpretation and ensure your template aligns with established benchmarks.
Comparison
| Feature | Prebuilt Google Sheets college comparison template | DIY Google Sheets college comparison setup |
|---|---|---|
| Ease of setup | High (ready-to-use, turnkey) | Moderate (requires design and data entry) |
| Customization depth | Moderate (template-driven) | High (full control over fields and formulas) |
| Best for | Fast deployment and consistent results | Tailored workflows and unique criteria |
| Collaboration | Easy sharing via Google Sheets | Requires coordination for editing and permissions |
| Cost range | Free to low-cost templates | Potentially low to moderate if you pay for advanced features |
The Good
- Speeds up decision-making with structured data
- Improves collaboration through a shared, auditable sheet
- Reduces errors with validation and standardized fields
- Offers a repeatable process for future cycles
The Bad
- DIY templates require more upfront time
- Prebuilt templates may not cover unique criteria
- Maintenance is needed to keep data current
Prebuilt templates win for speed and consistency; DIY wins for customization and future-proofing
Choose a prebuilt template when you need quick, reliable results for multiple programs. Opt for a DIY setup when your criteria are unique or you expect to scale or integrate with other data sources.
FAQ
What is a Google Sheets college comparison template?
A Google Sheets college comparison template is a structured spreadsheet designed to evaluate and compare colleges or programs using standardized criteria. It combines quantitative data (tuition, deadlines, duration) with qualitative notes (campus culture, internship opportunities) to support data-driven decisions.
It's a ready-made sheet you can customize to compare colleges side by side.
How do I customize weights for criteria?
Assign a weight to each criterion based on its importance to you. Use a weighted scoring formula that multiplies each criterion score by its weight and then sums the results to produce an overall score per college.
Give the most important factors bigger numbers, and let the sheet compute the final score.
Can I share this template with teammates?
Yes. Store the sheet in a shared drive, set appropriate editing permissions, and provide a short guide tab with definitions and scoring rules. Protect critical formulas to prevent accidental edits.
Absolutely—just share the link with the right access and add a quick how-to guide.
Is a prebuilt template better than a DIY setup?
A prebuilt template is faster to deploy and guarantees a tested layout. A DIY setup offers maximum customization. Start with a template and adjust it to your needs as you learn what factors matter most.
Prebuilt gets you going fast; DIY helps when you have unique needs.
What data should I track for scholarships and costs?
Track tuition ranges, housing costs, meal plans, books, scholarships received or applied for, and estimated aid. Include sources and update dates to keep your data trustworthy.
Include all costs and aid so you can compare apples to apples.
The Essentials
- Start with a solid prebuilt template to save time
- Weight criteria to reflect your priorities
- Use data validation to prevent errors
- Share a clear, auditable decision record
- Update data regularly to keep decisions relevant