Profit and Loss Template in Google Sheets: Step-by-Step Guide
Learn how to build and customize a profit and loss template in Google Sheets. Step-by-step setup, essential formulas, and best practices for students, professionals, and small business owners.

By the end of this guide, you’ll be able to create a practical profit and loss template google sheets from scratch and customize it for monthly or quarterly reporting. You’ll set up revenue and expense categories, add formulas for subtotals and net income, and build simple charts to visualize profitability. It’s ideal for students, professionals, and small businesses.
What is a Profit and Loss Template in Google Sheets?
A profit and loss (P&L) template in Google Sheets is a structured workbook that helps you track revenues, costs, and profitability over a defined period. It organizes revenue streams, cost of goods sold (COGS), gross profit, operating expenses, and net income, so you can see how money flows through your business. This template can be used monthly or quarterly and is ideal for collaborative budgeting because anyone with access can view or edit in real time. According to How To Sheets, a well-designed P&L template reduces manual errors and makes financial health visible at a glance. The flexible nature of Google Sheets lets you tailor categories to your business model, apply currency formatting, and connect simple charts that update as data changes. In practice, you’ll see a clean layout that separates revenue, expenses, and profits while offering a quick snapshot of trends.
Why use a P&L template for small businesses
A P&L template helps you answer critical questions fast: Are you trending toward profitability this quarter? Which expense areas are consuming the most resources? By standardizing the structure, you can compare periods, forecast future results, and share a transparent view with lenders, partners, or teammates. For students, it’s a hands-on way to learn financial literacy and decision making; for professionals, it’s a reliable tool for monthly reporting; for small business owners, it supports cash flow planning and budgeting. How To Sheets analysis shows that templates reduce inconsistent reporting, enabling more confident strategic choices and fewer last-minute scrambles at month-end. Templates also make it easier to audit numbers later on because everything follows the same rules and formulas.
Key components of a P&L template
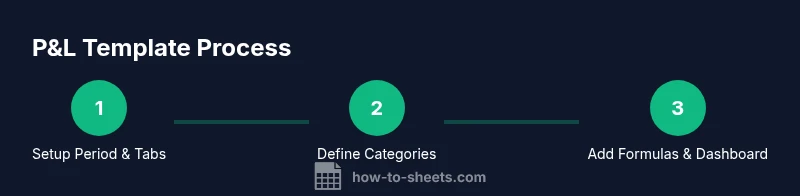
A practical P&L template typically includes: 1) a period header (month, quarter, or year), 2) revenue lines by source, 3) COGS or direct costs, 4) gross profit, 5) operating expenses (marketing, salaries, rent, utilities, etc.), 6) other income/expenses, 7) taxes, and 8) net income. Many templates also feature a dashboard with charts showing revenue vs. expenses and a variance column comparing actuals to budget. Having a dedicated section for notes and assumptions helps support future audits and adjustments. The template should be built with clear category naming, consistent currency formatting, and simple totals that auto-update as you fill data.
How to customize your P&L template in Google Sheets
Customization begins with a clean canvas. Create a new sheet or copy a starter template, then set up a period header and a table with columns for Description, Amount, and Category. Use SUM to total revenue and expenses, and employ SUMIFS to pull totals by category and period. Build a Net Income cell as Revenue minus Expenses, and add a small dashboard tab that charts monthly revenue, monthly expenses, and net income. Connect data sources through simple references or named ranges, and protect critical cells to prevent accidental edits. Google Sheets’ sharing permissions enable collaboration while preserving data integrity.
Best practices for accuracy and transparency
Maintain consistent categorization across periods so you can compare apples-to-apples. Use data validation to restrict category choices, and employ named ranges to simplify formulas and reduce errors when categories change. Regularly audit formulas for references, especially after adding new rows. Create a quarterly backup and keep a version history so you can roll back if needed. Finally, publish or export the P&L as a PDF for stakeholders, ensuring the numbers are presentable and easy to review.
Common pitfalls and how to avoid them
Common mistakes include mixing operating expenses with COGS, double-counting items, or failing to update data after a period ends. To avoid these, separate revenue, COGS, and operating expenses clearly, review totals monthly, and test formulas with a few sample entries before entering real data. Don’t forget to refresh currency formats and ensure debits and credits balance in the template. If you share the sheet, set permission levels carefully and provide a short user guide to reduce misentries.
Tools & Materials
- Google account with access to Google Sheets(Needed to create, edit, and save the P&L template in Sheets)
- Baseline financial data source(Revenue and expense records for at least 3–6 months for testing and calibration)
- Pre-built P&L formulas(Optional; can be embedded in the template for subtotals and net income)
- Currency formatting and locale settings(Useful for clarity and consistency across periods)
- Google Sheets template file(Start from a blank sheet or a starter P&L template and customize)
- Basic data validation rules(Helps ensure consistent categorization (e.g., dropdowns for categories))
Steps
Estimated time: 60-90 minutes
- 1
Create a new Google Sheet for the P&L
Open Google Sheets and start a blank workbook. Name the file with the current period (for example, 2026_Q1_PandL). Create a dedicated tab for the data and a second tab for the dashboard. This separation helps keep raw data isolated from visuals.
Tip: Use a period-based naming convention to simplify archiving and comparisons. - 2
Define revenue categories
List revenue streams (product sales, service income, etc.) and assign each a clear, concise label. Include a subtotal row that sums all revenue lines. This structure supports easy recalculation if a new revenue channel is added later.
Tip: Keep categories stable across periods to enable reliable trend analysis. - 3
Define COGS and expense categories
Separate COGS from operating expenses. Add lines for each major cost (materials, direct labor, marketing, rent, utilities). Create a COGS subtotal and an operating expenses subtotal for clarity. This separation improves margin visibility.
Tip: Label COGS clearly and keep it distinct from other expenses. - 4
Add formulas for totals and net income
Use SUM to total revenue and expenses. Compute Gross Profit as Revenue minus COGS, and Net Income as Gross Profit minus Operating Expenses plus any other income. Place key totals in clearly labeled cells with borders for readability.
Tip: Double-check that each total references the correct rows; test with dummy data. - 5
Create a basic dashboard
On a separate tab, create charts (bar or line) for revenue vs. expenses and a line chart for net income over time. Add a small table summarizing year-to-date totals to provide a quick read of profitability at a glance.
Tip: Link dashboard charts to dynamic ranges so they auto-update when you add data. - 6
Protect and share
Lock key formulas and totals to prevent accidental edits while allowing collaborators to enter raw data. Use share settings to control who can edit or view. Add a short guide on how to use and update the template.
Tip: Enable version history so you can revert if changes create inconsistencies.
FAQ
What is a P&L template and why should I use one?
A P&L template is a structured sheet that tracks revenue, costs, and profitability over a period. It standardizes data entry, reduces errors, and provides a clear view of financial health for decision making.
A P&L template tracks revenue and expenses to show profit, making it easy to review financial health.
How can I customize the P&L categories for my business?
Start with a core list of revenue streams and expense areas relevant to your model. Use primary categories and subcategories, then keep a consistent naming convention across periods so comparisons are meaningful.
Begin with your main revenue and expense groups and keep names consistent.
Can I link the template to real-time data sources?
Yes. You can link the template to other Google Sheets using functions like IMPORTRANGE or by importing data daily. Ensure data validation remains intact when pulling data dynamically.
You can pull data from other sheets and refresh regularly.
Is a P&L template the same as a financial statement?
A P&L template is a drill-down tool focused on income and expenses. A financial statement is broader, including balance sheets and cash flow. Use a P&L within the larger reporting framework for clarity.
A P&L is part of financial reporting but not the entire financial statement.
How do I share and collaborate on the template?
Use Google Sheets’ share settings to grant view or edit access. Provide a short usage guide and establish edit permissions only for trusted collaborators to protect data integrity.
Share with proper permissions and provide a brief guide.
What should I do if revenue fluctuates seasonally?
Create season-specific lines or monthly columns to capture volatility. Compare seasonality year-to-year and include notes about expected seasonality in the assumptions section.
Account for seasonal patterns with dedicated lines and notes.
Watch Video
The Essentials
- Define period and categories before data entry.
- Keep COGS separate from operating expenses for clear margins.
- Automate totals and use a dashboard for quick insights.
- Protect formulas and maintain version history for safety.