Creating a Google Sheets Scatter Plot: A Step-by-Step Guide
Learn to create and interpret a google sheets scatter plot with a practical, step-by-step guide covering data preparation, chart setup, axis labeling, trendlines, and interpretation.

You will learn how to create a google sheets scatter plot to visualize the relationship between two numeric variables. Before you begin, ensure your data sits in two numeric columns with headers, and decide which variable is X and which is Y. This guide covers data prep, chart insertion, axis customization, trendlines, and interpretation to help you extract clear insights.
What a google sheets scatter plot reveals and when to use it
A google sheets scatter plot is a simple yet powerful way to visualize the relationship between two quantitative variables. By plotting each data point as a dot, you can quickly spot patterns, clusters, trends, and potential outliers. This is particularly helpful in experiments, financial analyses, or any scenario where you want to test whether increases in one variable relate to increases (or decreases) in another. According to How To Sheets, starting with clean, well-labeled data makes the plot easier to read and interpret. When you see a positive or negative trend, you can form hypotheses for further testing or decision-making. The keyword here is clarity: the chart should tell a story at a glance. In practice, a well-designed google sheets scatter plot communicates insights to both technical and non-technical stakeholders, supporting data-driven choices.
Preparing your data for a scatter plot
Your data should live in two numeric columns, with a header row describing each series. Put the independent variable (often X) in the first column and the dependent variable (Y) in the second. Ensure there are no text values in these columns, and remove missing cells or fill them consistently. If you want each point labeled, add a third column with labels. A clean, organized sheet makes the next steps faster and reduces confusion when you customize the chart. Also consider formatting numbers consistently (decimal places, comma separators) so the scale on the axes reads cleanly.
Step-by-step overview
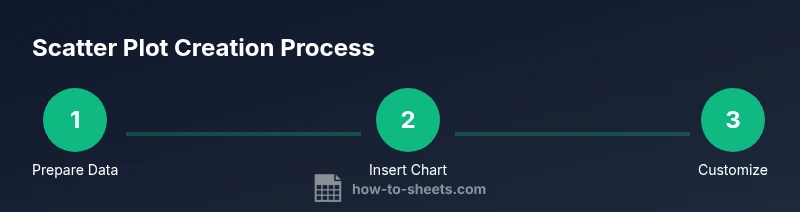
Think of the scatter plot as a visual probe for relationships. You’ll select your data, insert a chart, pick the Scatter option, and then refine the axes, labels, and legend. A trendline helps summarize the overall direction, while careful handling of outliers reveals whether anomalies are data errors or meaningful exceptions. The goal is a chart that is accurate, legible, and ready to share with teammates or clients.
Inserting a Scatter chart in Google Sheets
To create the chart, select both data columns including headers, then open Insert > Chart. In the Chart editor, switch Chart type to Scatter chart. If you don’t see it, scroll through the type options or check that your data contains numeric values. Google Sheets will place a default scatter plot on the sheet; you’ll customize it in the next section. The ability to preview changes instantly makes Google Sheets convenient for iterative exploration.
Customizing axes, titles, and legend for readability
Axis titles should clearly describe what each axis represents, including units if applicable. Adjust the horizontal (X) and vertical (Y) axis scales to fit your data range, and set minimums/maximums to avoid unnecessary white space. Add a concise chart title and a legend that identifies data series if you’re using more than one. Consistent fonts and sizes improve legibility, especially when you present to a group.
Adding a trendline and reading the correlation
A trendline summarizes the direction of the relationship. In the Chart editor, enable Trendline and choose a linear or polynomial fit based on your data. Use the R-squared value, if shown, as a rough indicator of fit quality, but interpret it in context. A trendline can help stakeholders grasp the overall pattern without scrutinizing every point. Remember that correlation does not imply causation; data context matters.
Handling outliers and data quality in scatter plots
Outliers can distort the apparent relationship. Review any points far from the cluster; determine if they are data entry errors or meaningful observations. Consider creating a filtered view or separate plot excluding obvious outliers to verify whether the overall pattern remains. Maintain data integrity by validating sources and documenting any data cleaning steps.
Presenting, sharing, and exporting your chart
Google Sheets charts can be embedded in slides or documents, or exported as images for reports. When sharing, ensure collaborators can access the source data or export settings. Keep accessibility in mind by providing alt text descriptions and avoiding overly small fonts. A polished scatter plot, with clear labels and concise annotations, supports effective communication.
Tools & Materials
- Google Sheets access(Use a Google account to open Sheets and save your work)
- Two numeric data columns with headers(X value column and Y value column; optional: a third column for labels)
- Clear axis labels and units(Helps readers understand what each axis means)
- A device with internet access(For on-the-go chart editing)
Steps
Estimated time: 15-25 minutes
- 1
Prepare data
Ensure two numeric columns exist with headers and that there are no text values in the numeric columns. Clean blanks or fill them consistently.
Tip: Keep data types consistent to avoid misinterpretation on the chart. - 2
Insert chart
Select both data columns (including headers) and go to Insert > Chart to create a default chart.
Tip: If the chart editor pane doesn’t appear, click the chart to activate it. - 3
Set chart type to Scatter
In the Chart editor, change Chart type to Scatter chart to display points rather than bars or lines.
Tip: If you don’t see Scatter, scroll through options or check numeric data. - 4
Customize axes and titles
Add axis labels and adjust axis min/max to fit the data range. Ensure the chart title is descriptive.
Tip: Use consistent units and avoid clutter by limiting text in axis labels. - 5
Add a trendline
Enable Trendline in the Chart editor and choose linear or polynomial fit based on data pattern.
Tip: Compare trendline to the data points to assess how well it fits. - 6
Review and share
Check readability, export as image or embed in slides, and share the sheet with collaborators.
Tip: Include a brief caption or annotation to highlight key insights.
FAQ
What data format do I need for a Google Sheets scatter plot?
You need two numeric columns with headers and clean data (no text values in the numeric columns).
Two numeric columns with headers and clean data are required for a scatter plot.
Can I add a trendline to a scatter plot in Google Sheets?
Yes. In the Chart editor, enable Trendline and choose the appropriate fit type.
Yes, you can add a trendline in the chart editor and choose the fit type.
How do I format axes for readability?
Use the Axis options to set titles, min/max, and tick marks to improve readability.
Format the axes by adjusting titles, scales, and tick marks.
How can I share or export the chart?
Publish, download as an image, or copy the chart into a slide or document.
You can share the sheet or export the chart as an image or slide.
What are common scatter plot mistakes?
Mixing data types, ignoring outliers, and overcrowding the chart with labels are common issues.
Common mistakes include mixed data types and ignoring outliers.
Watch Video
The Essentials
- Choose two numeric columns and label axes clearly.
- Use a Scatter chart to reveal relationships and outliers.
- Add a trendline to summarize the direction of the relation.
- Share the chart with context for meaningful interpretation.